說到效能分析就會想到 pprof
本篇文章,先帶大家使用一下golang的pprof套件
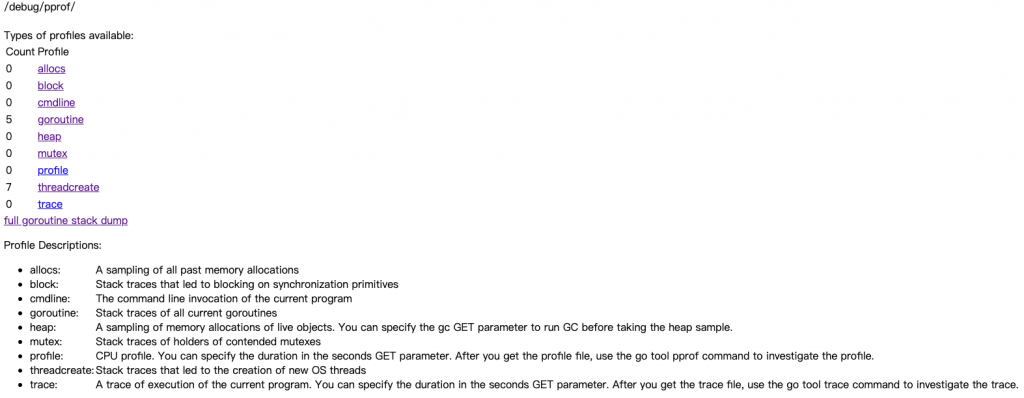
https://golang.org/pkg/net/http/pprof/
cpu: cpu profile 是在哪邊花費CPU的時間。
heap: 記憶體當下以及過去的使用情況,並檢查記憶體洩漏
「Heap」 由於是動態配置的記憶體空間,其存活時間不規律不可預測的,故需使用者自行回收空間。
所以若GC處理不好,就會發現有程序狂吃記憶體的情況。
threadcreate: Thread的線程
「stack」用來儲存 Value Types (Primitives)的地方,其特性是 LIFO (後進先出),用來儲存物件的 stack 與 run-time 的 call stack 運作原理是一樣的,run-time 的 stack frame 包含了:
Parameters:函數的參數
Return address:回傳位址,當func執行完,從哪行code繼續執行
Local variables:區域變數
來源 - Stack vs. Heap
block: block profile 顯示 goroutine在哪裡阻塞(含timer channels)的等待。預設是關閉的,需要使用 runtime.SetBlockProfileRate 去開啟它。
mutex: Mutex profile 報告鎖的競爭. 如果您認為由於互斥鎖爭用而無法充分利用CPU. 預設是關閉的,需要使用 runtime.SetMutexProfileFraction 去開啟它。
請大家在code內掛出一個http服務
http.ListenAndServe("localhost:6060", nil)
example
package main

import (
	"fmt"
	"net/http"
	_ "net/http/pprof"
)

func main() {
	_, err := fmt.Println("Hello, ithome")
	if err == nil {
		gorace()
	}
}

func gorace() {
	c := make(chan bool)
	m := make(map[string]string)
	go func() {
		m["1"] = "a" // First conflicting access.
		c <- true
	}()
	m["2"] = "b" // Second conflicting access.
	<-c
	for k, v := range m {
		fmt.Println(k, v)
	}

	http.ListenAndServe("localhost:6060", nil)
}
有簡易的Web可以看報告
go tool pprof http://localhost:6060/debug/pprof/heap
這時候會產生一個檔案 Saved profile in XXXX
Fetching profile over HTTP from http://localhost:6060/debug/pprof/heap
Saved profile in /Users/$mypc/pprof/pprof.alloc_objects.alloc_space.inuse_objects.inuse_space.001.pb.gz
Type: inuse_space
Time: Sep 23, 2020 at 4:50pm (CST)
Entering interactive mode (type "help" for commands, "o" for options)
(pprof)
使用 pprof UI介面打開檔案
go tool pprof -http=:8080 /Users/$mypc/pprof/pprof.alloc_objects.alloc_space.inuse_objects.inuse_space.001.pb.gz
Serving web UI on http://localhost:8080
使用瀏覽器開啟 http://localhost:8080
Graph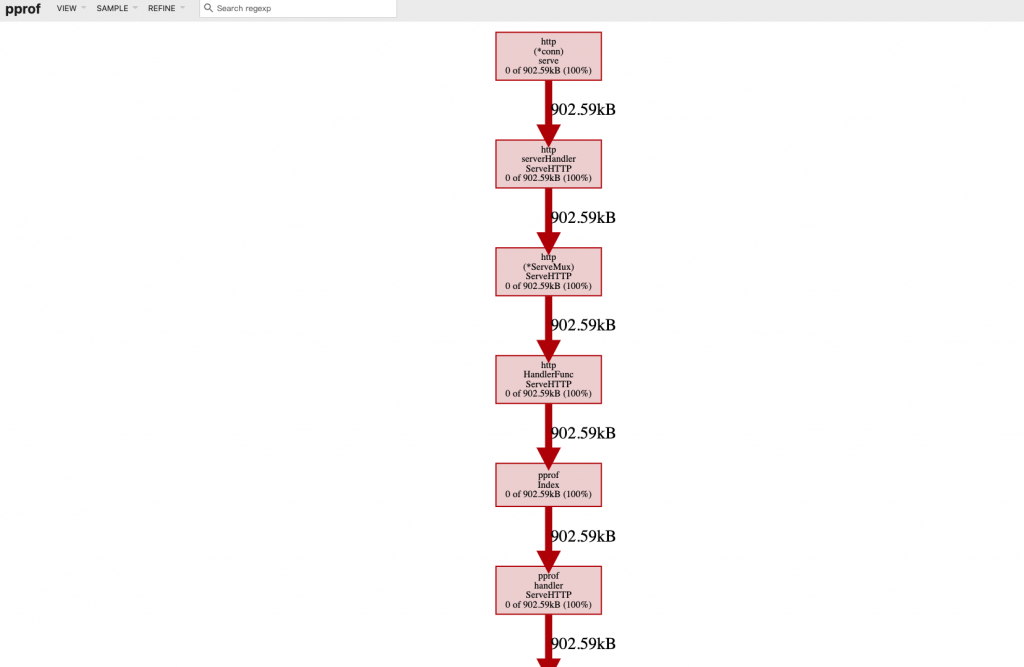
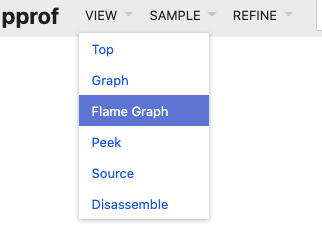
Flame Graph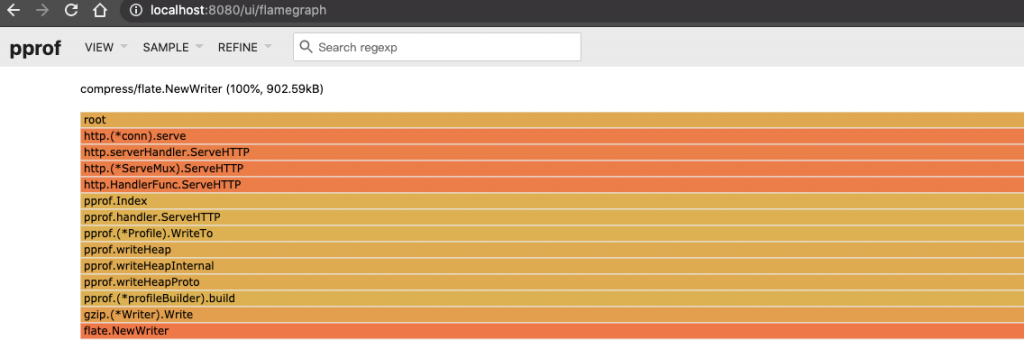
Top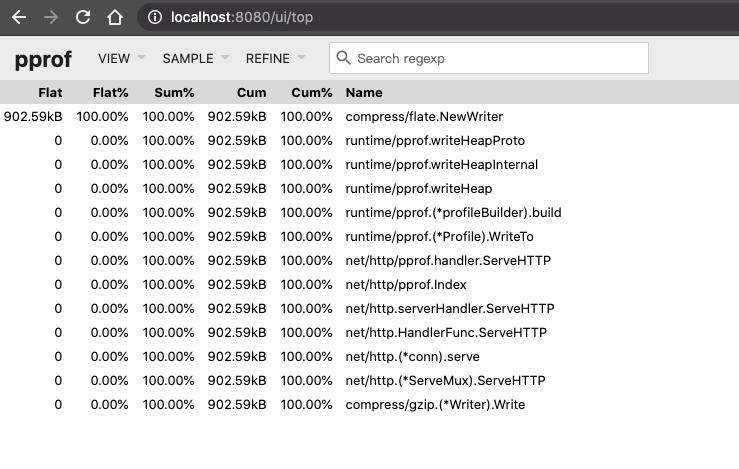
Source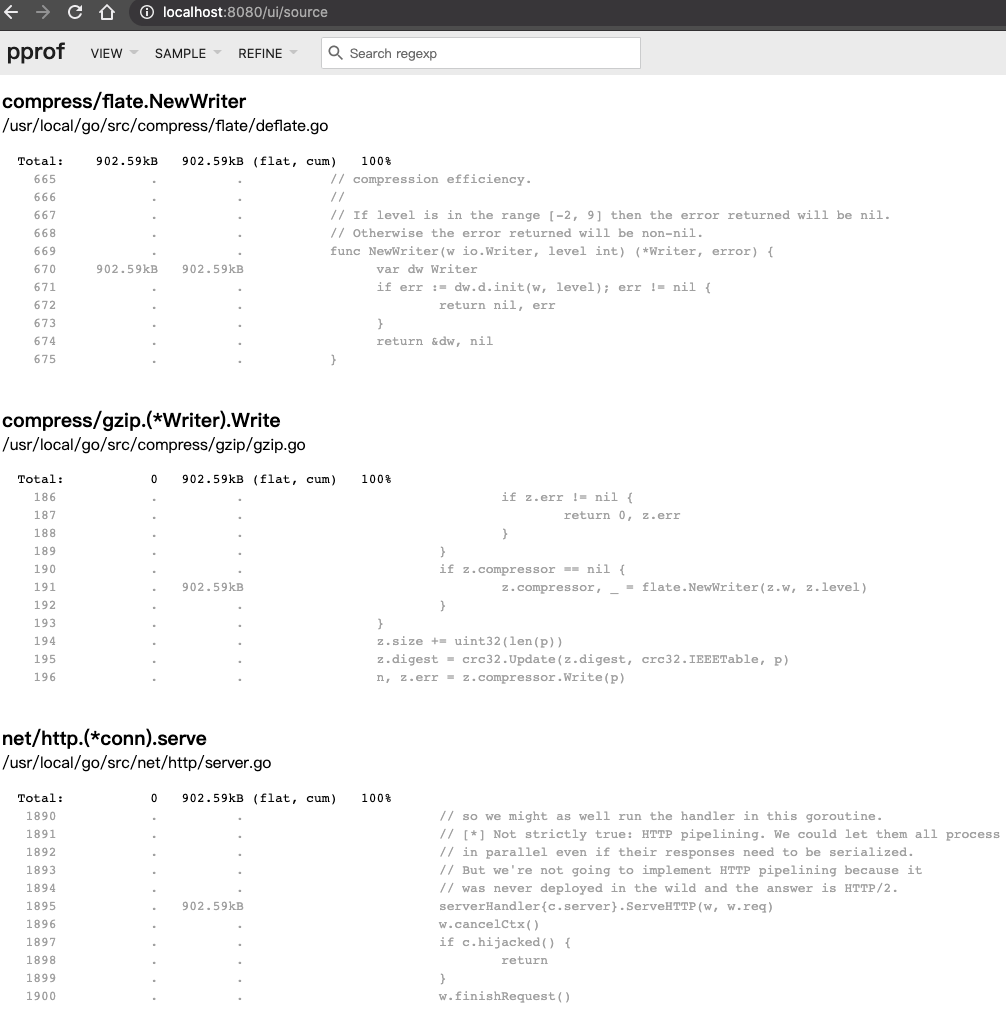
Can I profile my production services?
Yes. It is safe to profile programs in production, but enabling some profiles (e.g. the CPU profile) adds cost. You should expect to see performance downgrade. The performance penalty can be estimated by measuring the overhead of the profiler before turning it on in production.
You may want to periodically profile your production services. Especially in a system with many replicas of a single process, selecting a random replica periodically is a safe option. Select a production process, profile it for X seconds for every Y seconds and save the results for visualization and analysis; then repeat periodically. Results may be manually and/or automatically reviewed to find problems. Collection of profiles can interfere with each other, so it is recommended to collect only a single profile at a time.
要開啟pprof及相關參數的話,請注意!文件說明上有提到建議一次只收集一種 profile,設定的參數可能會相互干擾。
真的非常多人不懂火焰圖怎麼看!
由於我還沒完整的整理起火焰圖的說明,所以我推薦幾篇好文給各位參考
pprof 真的是效能分析的利器,希望大家學習並熟悉它!
雖然需要花很長時間,但它真的是能幫你找出吃資源的猛獸,也是效能優化的好助手。
關於go tool pprof http://localhost:6060/debug/pprof/heap
請問進入之後 是否就只是只能看下go tool pprof的那個時間點發生的狀況。
裡面不管怎麼下top,看起來都是一樣的數值。
但如果使用瀏覽器 http://localhost:6060/debug/pprof
一直刷新是會看到有變化的。
所以應該是要再有問題發生的當下準確的下go tool pprof 才能看到問題對嗎?
是的,通常我會在已知slow的地方塞log,然後在本機測試慢慢找出原因,但如果你有使用GCP他們有幫你搜集起來,可以找到特定區間的資料,蠻方便的。
可以參考此篇
https://cloud.google.com/profiler/docs/quickstart