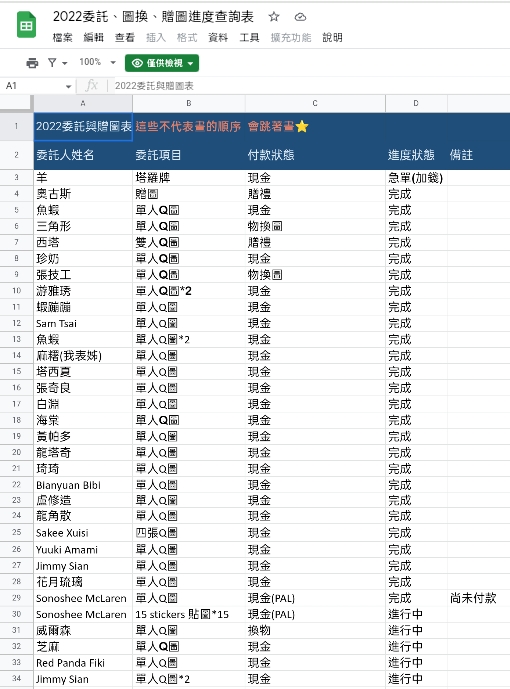
直接把整個試算表連結發給別人除了要載入很久且會出現一堆不需要的按鍵,整個畫面很醜很沒有質感。而且如果你把其他隱私的資料也放在裡面,都會被一次看光光。那我們就來幫試算表包個糖衣吧。
本篇文章來自毛哥EM資訊密技,較長的程式碼會摺疊。如果你覺得這篇文章有幫助到你歡迎在Instagram或Google新聞追蹤給一點鼓勵

當你要分享表格給其他人看時,使用Google試算表把連結貼給別人是一個簡單快速的方法。除了可以套各種公式,修改資料會馬上同步,也可以開設權限讓其他人一起編輯。
罷特如果只是要給別人看資料比如說客戶名單、訂單資訊、直接把整個試算表連結發給別人除了要載入很久且會出現一堆不需要的按鍵,整個畫面很醜很沒有質感。而且如果你把其他隱私的資料也放在裡面,都會被一次看光光。

我們來做一個超簡單的小網頁讓它自己去表格抓你要的資料來顯示。我們會寫一些程式(HTML,CSS,Js)不過如果你不會也沒關系w只要跟著步驟複製貼上就可以了。今天我要來幫我的畫家朋友薩波來做一個網站讓他的委託人可以查看他畫圖的進度,還要讓電腦排序讓已經完成的委託排在下面。成果:毛哥EM的基地
你可以使用任何一個可以給你存放網站代碼的地方,比如說Github。
我從Codepen上找到了一個很好看的表格模板來做修改。它在螢幕尺寸太窄的時候會用不同的版面來顯示,保持使用者體驗。你也可以找其他的模板或者是自己建立一個。
我在網站上增加了一點文字、顏色(CSS)、超連結(<a>)、還有圖片、縮圖。以及簡單的出場動畫(animate.css)來炫技。
<!DOCTYPE html>
 <head>
     <meta charset="utf-8" />
     <!--下面這行是標題-->
     <title>薩波進度查詢表</title>
     <meta name="viewport" content="width=device-width, initial-scale=1" />
     <!--下面這行是縮圖,可以換網址-->
     <link href="https://Edit-Mr.github.io/code/sabooo/thumbnail.png" rel="icon" type="image/x-icon">
     <link rel="stylesheet" type="text/css" href="https://Edit-Mr.github.io/css/Animate.css" media="screen">
     <!--下面這行是主題顏色,可以自由更換(支援HEX)-->
     <meta name="theme-color" content="orange" />
     <script src="https://cdnjs.cloudflare.com/ajax/libs/jquery/1.11.1/jquery.min.js"></script>
    <!--下面這些是樣式,可以自由更換顏色之類的-->
     <style>
         @import url(https://fonts.googleapis.com/earlyaccess/cwtexyen.css);

         body {
             font-family: "Arial","cwTeXYen","微軟正黑體";
             background-color: #fee5bd;
         }

         .container {
             max-width: 1000px;
             margin-left: auto;
             margin-right: auto;
             padding-left: 10px;
             padding-right: 10px;
             font-size: 25px;
         }

         h2 {
             font-size: 23px;
             margin: 0;
             text-align: center;
             font-weight: 150;
             color: #e69137;
             animation: fadeIn;
             animation-duration: 1.5s;
             animate-delay: 0.9s;
         }

         h1 {
             font-size: 35px;
             margin: 20px 0 0 0;
             text-align: center;
             size: 30px;
             color: #351c75;
             animation: zoomIn;
             animation-duration: 1s;
         }

         li {
             border-radius: 3px;
             padding: 25px 30px;
             display: flex;
             justify-content: space-between;
             margin-bottom: 25px;
         }

         .responsive-table .table-header,
         .table-note {
             background-color: #f9a756;
             font-size: 30px;
             margin-top: 0px;
             padding: 25px 30px 25px 30px;
             animation: slideInUp;
             animation-duration: 1.5s;
         }

         .table-note {
             font-size: 20px;
             display: none;
         }

         .responsive-table {
             margin: 0;
             padding: 0;
         }

         .responsive-table .table-row {
             background-color: #fff;
             box-shadow: 0px 0px 9px 0px rgba(0, 0, 0, 0.1);
             animation: backInLeft;
             animation-duration: 1.5s;
         }
         .table-row{}
         .responsive-table .col-1 {
             flex-basis: 25%;
         }

         .responsive-table .col-2 {
             flex-basis: 30%;
         }

         .responsive-table .col-3 {
             flex-basis: 30%;
         }

         .responsive-table .col-4 {
             flex-basis: 15%;
         }

         @media all and (max-width: 767px) {
             .responsive-table .table-header {
                 display: none;
             }

             .table-note {
                 display: block;
             }

             .responsive-table li {
                 display: block;
             }

             .responsive-table .col {
                 flex-basis: 100%;
             }

             .responsive-table .col {
                 display: flex;
                 padding: 10px 0;
             }

             .responsive-table .col:before {
                 color: #6c7a89;
                 padding-right: 10px;
                 content: attr(data-label);
                 flex-basis: 50%;
                 text-align: right;
             }
         }

         .header {
             width: 150px;
             display: block;
             margin: auto;
             animation: slideInUp;
             animation-duration: 1.5s;
         }

         .finished {
             color: green;
         }

         p,
         a {
             text-align: center;
             font-size: 15px;
             color: #6c7a89;
             text-decoration: none;
             animation: fadeIn;
             animation-duration: 1.5s;
         }
     </style>
 </head>

 <body>
     <div class="container">
         <h1>薩波2022委託與贈圖表</h1>
         <h2>這些不代表畫的順序 會跳著畫</h2>
         <img src="header.png" class="header" />
         <li class="table-note">
             如果要一次看完整表格請切換到電腦版網頁喔
         </li>
         <ul class="responsive-table">
             <li class="table-header">
                 <div class="col col-1">委託人姓名</div>
                 <div class="col col-2">委託項目</div>
                 <div class="col col-3">付款狀態</div>
                 <div class="col col-4">進度狀態</div>
             </li>
             資料載入中
         </ul>
         <p><a href=""></a> · Facebook<a href="https://instagram.com/">Instagram</a><br />Made by <a href="https://github.com/Edit-Mr">Edit Mr.</a> with❤</p>
     </div>
 </body>
好了前端做好了接下來我們來建另一個網站讓剛才那個網站來這裡讀取資料。為了方便起見我們在給資料的時候直接給一個做好的表格讓網站貼上。
我們先看一下試算表。在這裡我們可以看到每一行資料有5項,其中我希望第5項的資料可以放在付款狀態後面。現在請你先請你複製這個試算表的ID,也就是網址https://docs.google.com/spreadsheets/d/和/之間那一串(如1fjX-prGu0hfb65LCQkrktWa-JavvjSz7tWMmYWAb7RA)。等一下會用到。

我們會使用GAS(Google App Script)來建立網頁應用程式來讀取表格資料。
請到script.google.com 建立一個新的專案並貼上以下內容。記得貼上Google Sheet那段ID,並修改自己要的範圍,程式碼裡有詳細的註解。原理是讀取一行行的資料並轉成HTML表格,其中如果狀態是完成的加上一個class讓顏色變綠色。在排序方面我是把完成的和未完成的分成兩個陣列(清單)儲存,在把完成的接在未完成的後面合併。
function doGet(){
  var spreadsheet = SpreadsheetApp.openById('1U-Q2XXXXXXXRsrh-QYCXXXXXXXXXQmGQ'); // Sheet id
  var sheet = spreadsheet.getSheets()[0];
  var rowLength = sheet.getLastRow();
  var columnLength = sheet.getLastColumn();
  var data = sheet.getRange(3,1,rowLength,columnLength).getValues();
  var dataExport = ['<li class="table-header"><div class="col col-1">委託人姓名</div><div class="col col-2"++>委託項目</div><div class="col col-3">付款狀態</div><div class="col col-4">進度狀態</div></li>'];
  var stat, ed=[];
  // 一個個加入json
  for(i in data){
    if(data[i][0] != ""){
      if (data[i][3]=="完成"){
    ed.push('<li class="table-row"><div class="col col-1" data-label="委託人姓名">'+data[i][0]
+'</div><div class="col col-2" data-label="委託項目">'+data[i][1]
+'</div><div class="col col-3" data-label="付款狀態">'+data[i][2]+" "+data[i][4]
+'</div><div class="col col-4 finished" data-label="進度狀態">'+data[i][3]+'</div></li>')
      }else{
    dataExport.push('<li class="table-row"><div class="col col-1" data-label="委託人姓名">'+data[i][0]
+'</div><div class="col col-2" data-label="委託項目">'+data[i][1]
+'</div><div class="col col-3" data-label="付款狀態">'+data[i][2]+" "+data[i][4]
+'</div><div class="col col-4" data-label="進度狀態">'+data[i][3]+'</div></li>')
      }

    };
  };
  dataExport=dataExport.concat(ed);
  // 回傳JSON
  console.log(dataExport.join(""));
  return ContentService.createTextOutput(dataExport.join(""));
  }
{{% notice notice "為什麼要分兩個陣列?不要讓未完成的直接插入到最前面?" %}}
我們可以用push()將資料插入到最後面,也可以用unshift()插入到最前面。但是如果用這個方式未完成的清單順序會整個便相反
如順序1234567排序後不會變124589367,而是985421367。
你可以根據自己的需求決定排法
{{% /notice %}}

做好了之後點擊執行▶️,你會需要授予你的程式讀取資料的權限。因為你寫的程式沒有被Google驗證過所以會顯示不安全,但我相信你不會把你的帳號搞爆,對吧
接下來我們要部署它,讓它成為一個網站來讓我們抓。這裡選擇網頁應用程式,所有人都以你的身份讀取。按下部署就可以囉
這裡我們把部署的網址複製起來。如果要做修改除了按儲存之外要記得重新部署成新版本才會更新喔
接下來我們回到Github的網頁讓他來讀這個表格
可以當然是可以,姑且不論網址有多長多醜,如果使用Google App Script建設的網站會出現橫幅很醜的一個警告,而且他超長讓你的版面整個跑掉。為了更好的使用者體驗既然都做了就做到底吧!
最後一步了!我們回到程式碼的head裡面,加入jQuery這個套件讓我們可以少寫幾行
然後我們修改一下body。程式讀到表格之後會用表格取代class裡面的所有內容。我已在這裡可以寫一些表格讀取到之前會顯示的訊息比如說「資料讀取中...」之類的。
最後在我們在</body>前面貼上以下的JavaScript來讀取並顯示表格。記得把網址換成剛剛表格資料的網址喔~
<script>
         //請把下面按這串改成剛才的網址
         let requestURL = "https://script.google.com/macros/s/AKfycbxq942U9fZK5tR6Vi1OZkr5Hq0Bv_qPSm1rOOYFFZUS_vyrTu60QuW7xmU-d09UpI1XLQ/exec";
         let request = new XMLHttpRequest();
         request.open("GET", requestURL);
         request.responseType = "text";
         request.send();
         request.onload = function () {
             console.log("載入成功");
             $("p").addClass('animate_animated','animate_fadeOut') //動畫
             $(".responsive-table").html(request.response); //用表格取代.responsive-table
         };
     </script>
最終的程式碼如下,有沒有超有成就感?
<!DOCTYPE html>
 <head>
     <meta charset="utf-8" />
     <!--下面這行是標題-->
     <title>薩波進度查詢表</title>
     <meta name="viewport" content="width=device-width, initial-scale=1" />
     <!--下面這行是縮圖,可以換網址-->
     <link href="https://Edit-Mr.github.io/code/sabooo/thumbnail.png" rel="icon" type="image/x-icon">
     <link rel="stylesheet" type="text/css" href="https://Edit-Mr.github.io/css/Animate.css" media="screen">
     <!--下面這行是主題顏色,可以自由更換(支援HEX)-->
     <meta name="theme-color" content="orange" />
     <script src="https://cdnjs.cloudflare.com/ajax/libs/jquery/1.11.1/jquery.min.js"></script>
    <!--下面這些是樣式,可以自由更換顏色之類的-->
     <style>
         @import url(https://fonts.googleapis.com/earlyaccess/cwtexyen.css);

         body {
             font-family: "Arial","cwTeXYen","微軟正黑體";
             background-color: #fee5bd;
         }

         .container {
             max-width: 1000px;
             margin-left: auto;
             margin-right: auto;
             padding-left: 10px;
             padding-right: 10px;
             font-size: 25px;
         }

         h2 {
             font-size: 23px;
             margin: 0;
             text-align: center;
             font-weight: 150;
             color: #e69137;
             animation: fadeIn;
             animation-duration: 1.5s;
             animate-delay: 0.9s;
         }

         h1 {
             font-size: 35px;
             margin: 20px 0 0 0;
             text-align: center;
             size: 30px;
             color: #351c75;
             animation: zoomIn;
             animation-duration: 1s;
         }

         li {
             border-radius: 3px;
             padding: 25px 30px;
             display: flex;
             justify-content: space-between;
             margin-bottom: 25px;
         }

         .responsive-table .table-header,
         .table-note {
             background-color: #f9a756;
             font-size: 30px;
             margin-top: 0px;
             padding: 25px 30px 25px 30px;
             animation: slideInUp;
             animation-duration: 1.5s;
         }

         .table-note {
             font-size: 20px;
             display: none;
         }

         .responsive-table {
             margin: 0;
             padding: 0;
         }

         .responsive-table .table-row {
             background-color: #fff;
             box-shadow: 0px 0px 9px 0px rgba(0, 0, 0, 0.1);
             animation: backInLeft;
             animation-duration: 1.5s;
         }
         .table-row{}
         .responsive-table .col-1 {
             flex-basis: 25%;
         }

         .responsive-table .col-2 {
             flex-basis: 30%;
         }

         .responsive-table .col-3 {
             flex-basis: 30%;
         }

         .responsive-table .col-4 {
             flex-basis: 15%;
         }

         @media all and (max-width: 767px) {
             .responsive-table .table-header {
                 display: none;
             }

             .table-note {
                 display: block;
             }

             .responsive-table li {
                 display: block;
             }

             .responsive-table .col {
                 flex-basis: 100%;
             }

             .responsive-table .col {
                 display: flex;
                 padding: 10px 0;
             }

             .responsive-table .col:before {
                 color: #6c7a89;
                 padding-right: 10px;
                 content: attr(data-label);
                 flex-basis: 50%;
                 text-align: right;
             }
         }

         .header {
             width: 150px;
             display: block;
             margin: auto;
             animation: slideInUp;
             animation-duration: 1.5s;
         }

         .finished {
             color: green;
         }

         p,
         a {
             text-align: center;
             font-size: 15px;
             color: #6c7a89;
             text-decoration: none;
             animation: fadeIn;
             animation-duration: 1.5s;
         }
     </style>
 </head>

 <body>
     <div class="container">
         <h1>薩波2022委託與贈圖表</h1>
         <h2>這些不代表畫的順序 會跳著畫</h2>
         <img src="header.png" class="header" />
         <li class="table-note">
             如果要一次看完整表格請切換到電腦版網頁喔
         </li>
         <ul class="responsive-table">
             <li class="table-header">
                 <div class="col col-1">委託人姓名</div>
                 <div class="col col-2">委託項目</div>
                 <div class="col col-3">付款狀態</div>
                 <div class="col col-4">進度狀態</div>
             </li>
             資料載入中
         </ul>
         <p><a href="https://www.facebook.com/Sabo9335">薩波FB</a> · <a
                 href="https://instagram.com/sabooo_9335?igshid=YmMyMTA2M2Y=">薩波IG</a> · <a
                 href="https://discord.gg/ve9ERWVEPR">橘子牌太空船</a><br />Made by <a href="https://github.com/Edit-Mr">EDM</a> with❤</p>
     </div>
     <script>
         //請把下面按這串改成剛才的網址
         let requestURL = "https://script.google.com/macros/s/xxxxxxxx/exec";
         let request = new XMLHttpRequest();
         request.open("GET", requestURL);
         request.responseType = "text";
         request.send();
         request.onload = function () {
             console.log("載入成功");
             $("p").addClass('animate_animated','animate_fadeOut') //動畫
             $(".responsive-table").html(request.response); //用表格取代.responsive-table
         };
     </script>
 </body>
function doGet(){
  var spreadsheet = SpreadsheetApp.openById('xxxxxxxxxxxxxxx'); // Sheet id
  var sheet = spreadsheet.getSheets()[0];
  var rowLength = sheet.getLastRow();
  var columnLength = sheet.getLastColumn();
  var data = sheet.getRange(3,1,rowLength,columnLength).getValues();
  var dataExport = ['<li class="table-header"><div class="col col-1">委託人姓名</div><div class="col col-2"++>委託項目</div><div class="col col-3">付款狀態</div><div class="col col-4">進度狀態</div></li>'];
  var stat, ed=[];
  // 一個個加入json
  for(i in data){
    if(data[i][0] != ""){
      if (data[i][3]=="完成"){
    ed.push('<li class="table-row"><div class="col col-1" data-label="委託人姓名">'+data[i][0]
+'</div><div class="col col-2" data-label="委託項目">'+data[i][1]
+'</div><div class="col col-3" data-label="付款狀態">'+data[i][2]+" "+data[i][4]
+'</div><div class="col col-4 finished" data-label="進度狀態">'+data[i][3]+'</div></li>')
      }else{
    dataExport.push('<li class="table-row"><div class="col col-1" data-label="委託人姓名">'+data[i][0]
+'</div><div class="col col-2" data-label="委託項目">'+data[i][1]
+'</div><div class="col col-3" data-label="付款狀態">'+data[i][2]+" "+data[i][4]
+'</div><div class="col col-4" data-label="進度狀態">'+data[i][3]+'</div></li>')
      }

    };
  };
  dataExport=dataExport.concat(ed);
  // 回傳JSON
  console.log(dataExport.join(""));
  return ContentService.createTextOutput(dataExport.join(""));
  }
如果你覺得這篇文章有幫助到你歡迎在Instagram或Google新聞追蹤毛哥EM資訊密技
