今天要來教大家如何使用 Series 和 DataFrame 的數據製作圖表,在這之前要記得安裝 matplotlib 喔,如果不會安裝的話可以看上上篇的文章教學,否則會無法順利進行喔!
data = pd.Series([60, 25, 5, 10], index=['guitar', 'bass', 'cajon', 'violin'])
print(data)
輸出結果
guitar    60
bass      25
cajon      5
violin    10
dtype: int64
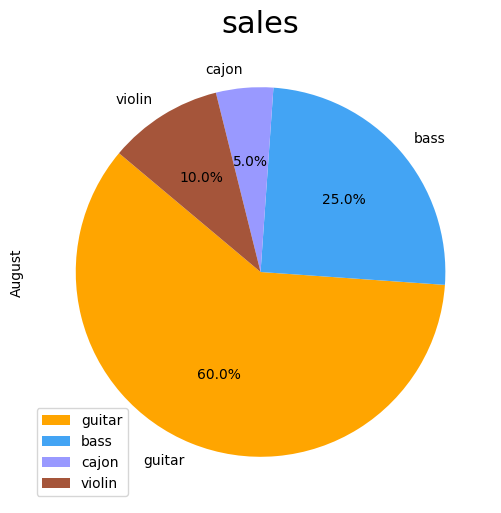
可以從下面的程式碼看到,Pandas 有對 Series 的物件提供了 .plot() 的方法,這樣就可以很方便的只要設定圖表參數,就可以直接從物件提取數據製圖
colors = ['orange', '#43A4F4', (0.6, 0.6, 1.0), '#A5553A']
#autopct用來設定切片的百分比顯示格式
#startangle用來設定圓餅圖角度
#figsize用來設定圖表大小
data.plot(kind='pie', ylabel='August', fontsize=10, colors=colors,
          autopct='%1.1f%%', startangle=140, legend=True, figsize=(10, 6))
plt.title('sales', fontsize=22)
plt.show()
輸出結果
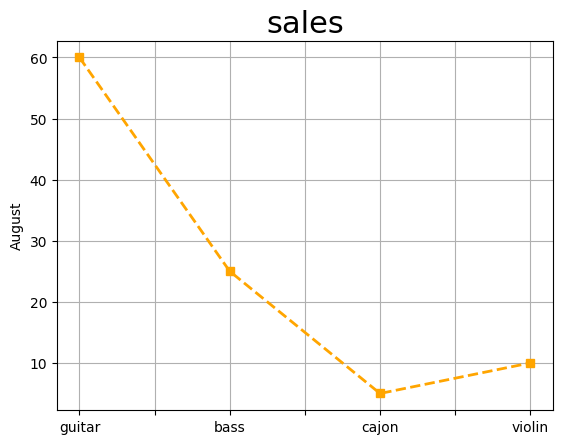
data.plot(kind='line', style='--', marker='s', grid=True,
          linewidth=2, ylabel='August', color='orange')
plt.title('sales', fontsize=22)
plt.show()
輸出結果
dict_ = {'guitar': [2, 3, 4], 'bass': [7, 6, 5], 'keyboard': [8, 9, 10]}
instrument = pd.DataFrame(dict_, index=['A', 'B', 'C'])
print(instrument)
輸出結果
   guitar  bass  keyboard
A       2     7         8
B       3     6         9
C       4     5        10
colors = ['orange', '#43A4F4', (0.6, 0.6, 1.0)]
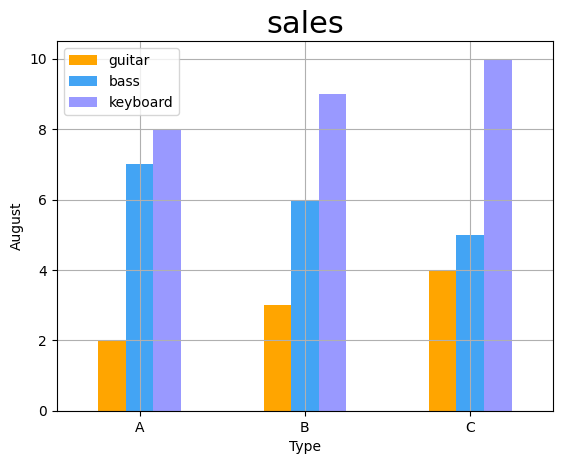
instrument.plot(kind='bar', grid=True, xlabel='Type', ylabel='August', color=colors, rot=0)
plt.title('sales', fontsize=22)
plt.show()
輸出結果
colors = ['orange', '#43A4F4', (0.6, 0.6, 1.0)]
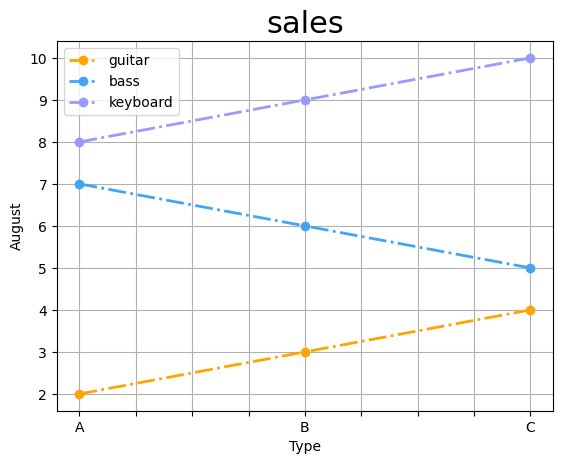
instrument.plot(kind='line', style='-.', marker='o', grid=True,
          linewidth=2, xlabel='Type', ylabel='August', color=colors)
plt.title('sales', fontsize=22)
plt.show()
輸出結果
經過了十四篇文章的介紹,相信讀者們應該都能感受到 Pandas 這個套件的強大,建議讀者們可以從這幾篇文章裡面提到的函數去做一些實際的應用,例如像是透過爬蟲把資料爬下來,再透過 Pandas 做數據的清洗,讓自己能對這個套件更加的熟練!
如果對文章內容有疑問或者有想補充的,歡迎在下方留言一起討論!
