iT邦幫忙

0

Chart.js 如何把曲線上的點消除?

  • 分享至 

  • twitterImage

想請教各位大大,我目前使用chart.js套件去繪製一個曲線圖表,但是我想打線上的點消除,使用了下面的語法但是都消不掉,想請問是哪邊有錯?

var lineChartData = {
labels: data,
datasets: [
{
label: "My First dataset", fillColor: "#FF0000",
strokeColor: "rgba(220,220,220,1)",
pointColor: "rgba(220,220,220,1)",
pointStrokeColor: "#fff",
pointHighlightFill: "#fff",
pointHitRadius: 0,
pointRadius: 0, pointHoverRadius: 0,
pointHighlightStroke: "rgba(220,220,220,1)",
data: [23, 34, 46, 56, 56],
},
]
};

froce iT邦大師 1 級 ‧ 2018-12-11 16:11:50 檢舉
pointColor: "rgba(220,220,220,1)",
pointStrokeColor: "#fff",
pointHighlightFill: "#fff",
pointHitRadius: 0,
pointRadius: 0, pointHoverRadius: 0,
pointHighlightStroke: "rgba(220,220,220,1)",

這幾行拿掉呢?
Homura iT邦高手 1 級 ‧ 2018-12-11 16:32:45 檢舉
程式碼貼完整...
還有用程式碼區塊包起來
圖片
  直播研討會
圖片
{{ item.channelVendor }} {{ item.webinarstarted }} |
{{ formatDate(item.duration) }}
直播中

1 個回答

0
youarefat
iT邦新手 5 級 ‧ 2018-12-13 11:17:58
{
    type:XXX,
    data:{...},
    options:{
        elements:{
            point:{
                radius:0
            }
        }
    }
}
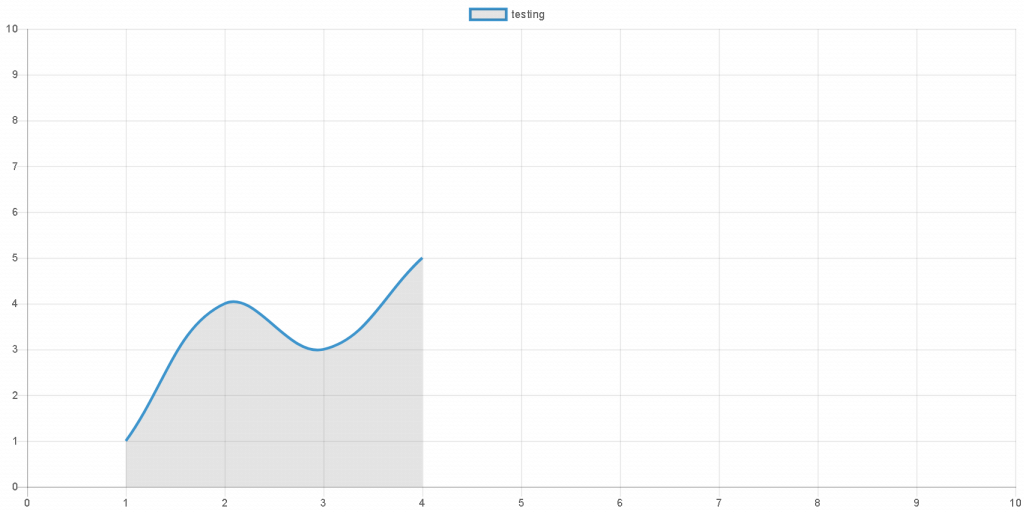
https://ithelp.ithome.com.tw/upload/images/20181213/20111439kCskfFn13S.png

我要發表回答

立即登入回答