以下為我的程式碼檔案,跑出來的圖十分奇怪,結果應為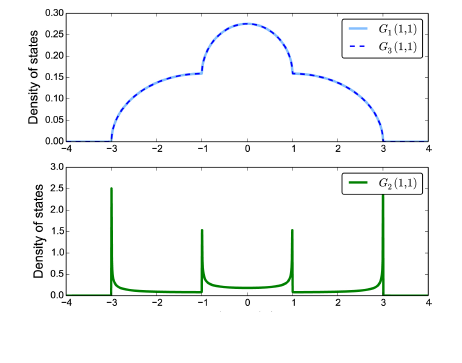
import matplotlib.pyplot as plt # Matplotlib library
import numpy as np
import cmath
from numpy.linalg import inv
from math import pi
i = complex(0,1)
e0 = 0.0 # local site energy
eta = 1e-4 # positive infinitesimal
Ne = 1000 # number of energy points
emin = -2.0; emax = 2.0 # energy range
envec = np.zeros(Ne) # vector to store the energies
tw = 1.0; # hopping between slices
m = 1e-12
tv = 1.0
V = np.matrix([[0,tv],[tv,0]]) # hopping matrix inside the slice
ImG1 = np.zeros(Ne); ImG2 = np.zeros(Ne); ImG3 = np.zeros(Ne) # global vectors for plotting
I = np.eye(2) # eye(n) = nxn identity matrix
Ndec = 18 # number of decimation iterations
for i in range (1,Ne) : # Energy loop
en = emin + (i-1)(emax-emin)/(Ne-1) # energy - real(n) is a conversion to float
W = np.matrix([[tw,0],[0,tw]]) # hopping matrix - between slices
g = (1./(en-e0+etaim))I # undressed Green’s function of a site
gV = inv(I - gV)g # Green’s function of a vertically coupled pair of sites
g1 = gV; g2 = gV; g3 = gV # initialization of three isolated slices
for j in range (1,Ndec) : # Decimation Loop in the horizontal direction
g1n = inv(I - g1Wg2W)g1 # effective auxiliary Green’s functions
g2n = inv(I - (g2Wg2W) - (g2Wg2W))g2
g3n = inv(I - g3Wg2W)g3
W = Wg2*W # effective hopping
g1 = g1n # update of the variables
g2 = g2n
g3 = g3n
G1 = inv(I - (g1*W*g2*W)*inv(I - g2*W*g3*W))*g1
G2 = g2
G3 = inv(I - (g3*W*g2*W)*inv(I - g2*W*g1*W))*g3
envec[i] = en # storing the energy mesh
ImG1[i] = np.imag(G1[1,1]) # storing the imaginary part
ImG2[i] = np.imag(G2[1,1])
ImG3[i] = np.imag(G3[1,1])
plt.subplots(211) # Create the first plot of a 2x1 group of subplots
plt.plot(envec,(-1./pi)*ImG1, linewidth=1.0, label="G_1(1,1)", color="#85beff")
plt.plot(envec,(-1./pi)*ImG3, linestyle="--", linewidth=1.0,label="G_3(1,1)")
plt.legend(loc="upper right",fancybox="true")
plt.ylabel("Density of states", fontsize=16)
plt.subplots(212) # Create the 2nd plot of a 2x1 group of subplots
plt.plot(envec, (-1./pi)*ImG2,label="G_2(1,1)", linewidth=1.0, color="g")
plt.legend(loc="upper right",fancybox="true")
plt.xlabel("(\omega-\epsilon_0)/t ", fontsize=20)
plt.ylabel("Density of states", fontsize=16)
plt.show()
已邀請的邦友 {{ invite_list.length }}/5

 iThome鐵人賽