TABLE有四個欄位 "商品代碼","個數","金額","販售日期"
商品代碼有四種以上,
販售日期有相同天與不同天
※需要呈現的結果:
(1) 銷售日期的時間需要去掉,只保留年,像是"2015"
(2) 商品代碼相同且需要同一年才可以將數量與金額總和
(3) 可以考慮到多個商品代碼
我的測試檔案:
https://drive.google.com/drive/folders/16La3zPzpNH4aLPeOGYza0pxTsGKAEHJl?usp=sharing
提供的內容:
輸出的錯誤圖示:
目前我想的語法會出現直條圖上出現多筆數值但不是加總數值合併,必需是同商品同1年的數量和金額都加總,
提供我目前我寫的語法:
import pandas as pd
import numpy as np
import warnings
from matplotlib import pyplot as plt
warnings.filterwarnings('ignore')

path = r'C:\Users\feather\Desktop'
df =pd.read_excel(path +'\COM_D.xlsx', encoding='ansi', header=0)
print(df.head())
df.info()

df["year"]=df["販售日期"].dt.year

def toDate(val):
    return val.date()
df["販售日期"]=df["販售日期"].apply(toDate)
df.sort_values(['year'],ascending=True)
result=df.groupby(['year','金額'])
print(result.sum)
df.reset_index(inplace=True)

from matplotlib.font_manager import FontProperties
myfont = FontProperties(fname=r"D:\Anaconda3\Lib\site-packages\matplotlib\mpl-data\fonts\ttf\kaiu.ttf", size=30)

plt.figure(figsize=(8,6))
bar1 = plt.bar(df['year'],df['金額'], width = 0.5, alpha = 0.2, color = 'r')
plt.title("每年出售總金額", FontProperties=myfont, size=10)
plt.xticks(df['year'], FontProperties=myfont, size=10)
plt.xlabel('每年year')
plt.ylabel('金額dollar')
plt.legend()
for rect in bar1:
    height = rect.get_height()  #bar1的高度
    plt.text(rect.get_x() + rect.get_width() / 2, height+3, str(height), ha="center", va="bottom")
真正需要的結果(數值+圖示表示)
請問如何改善查詢結果的方式
謝謝

接續在你這串後面:
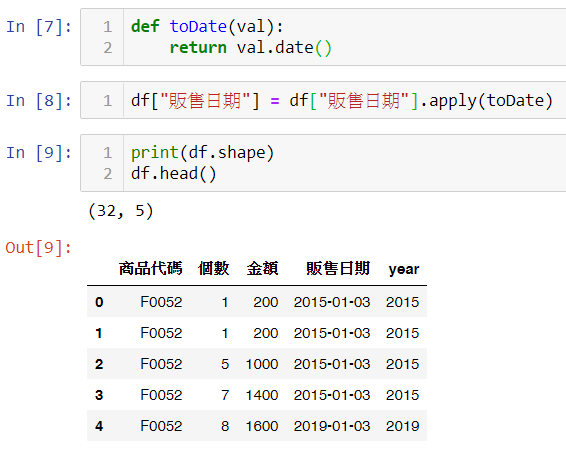
def toDate(val):
    return val.date()
df["販售日期"]=df["販售日期"].apply(toDate)
到上面為止長這樣~
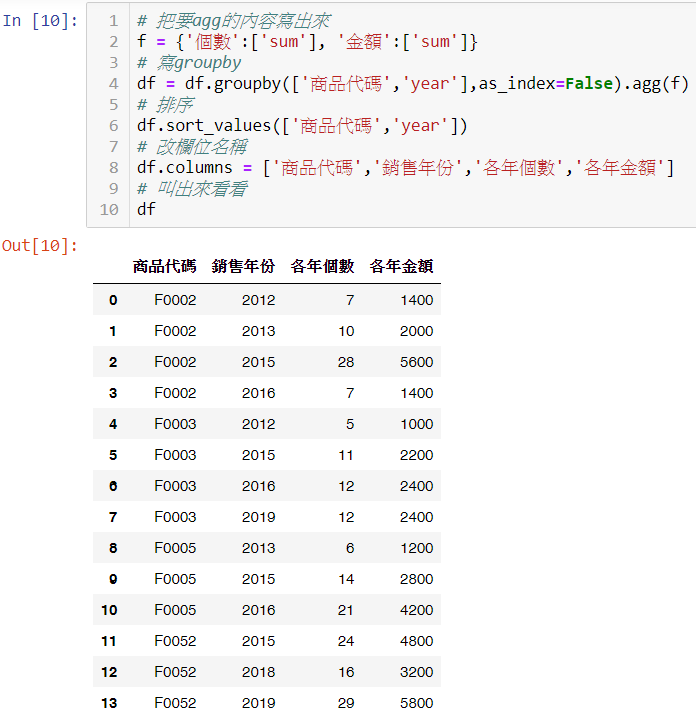
加上這些語法:
# 把要agg的內容寫出來
f = {'個數':['sum'], '金額':['sum']}
# 寫groupby
df = df.groupby(['商品代碼','year'],as_index=False).agg(f)
# 排序
df.sort_values(['商品代碼','year'])
# 改欄位名稱
df.columns = ['商品代碼','銷售年份','各年個數','各年金額']
# 叫出來看看
df
就可以長這樣~