弱弱地想請問一下
我使用xlsxwriter套件作圖
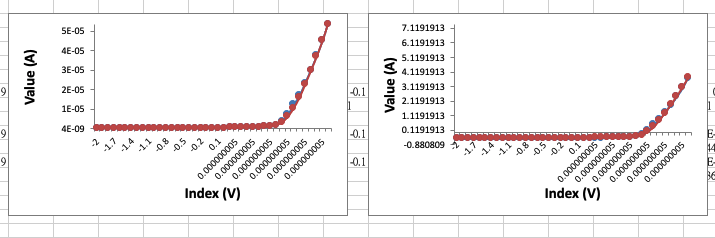
兩張圖程式都一樣
為什麼左邊Y軸式顯示科學記號,和右邊不是??
我都想要固定顯示科學記號,該怎麼做??
至於X軸我想要固定顯示小數點以下第二位
以下是我分別做兩張圖的程式碼
col_chart.set_x_axis({
            'name':'Index (V)',
            'name_font': {'size': 15, 'bold': True},
            'min':min(Vsd),
            'max':max(Vsd),

        })
        col_chart.set_y_axis({
            'name':'Value (A)',
            'name_font': {'size': 15, 'bold': True},
            'major_gridlines':{'visible':False},
            'min':min(Isd),
            'max':max(Isd),

        })
        col_chart.set_legend({'position':'none'})

        col_chart_2.set_x_axis({
            'name':'Index (V)',
            'name_font': {'size': 15, 'bold': True},
            'min':min(Vsd),
            'max':max(Vsd),
        })
        col_chart_2.set_y_axis({
            'name':'Value (A)',
            'name_font': {'size': 15, 'bold': True},
            'major_gridlines':{'visible':False},
            'min':min(Isd_normalization),
            'max':max(Isd_normalization),
        })
        col_chart_2.set_legend({'position':'none'})
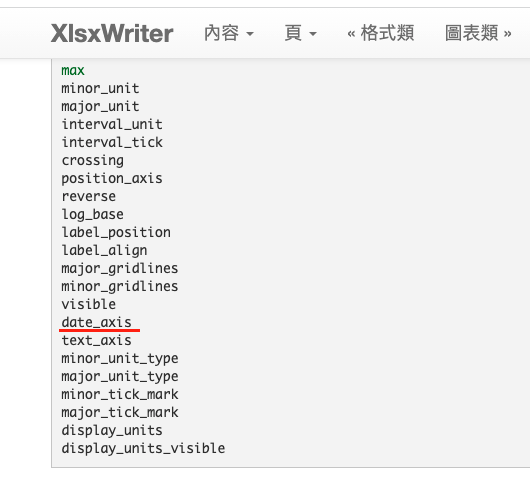
我查過一些文件
https://xlsxwriter.readthedocs.io/chart.html?highlight=add_series#add_series
但目前只看到固定顯示日期的參數設定
沒有看到科學記號及小數點下第二位??
已邀請的邦友 {{ invite_list.length }}/5
沒有使用過 xlsxwriter
剛看文件是這個嗎?
chart.set_x_axis({'num_format': '0.00'})
chart.set_y_axis({'num_format': '0.00E+00'})

chart.set_num_format('0.00')
chart.set_num_format('0.00E+00')
https://xlsxwriter.readthedocs.io/format.html#set_num_format

 iThome鐵人賽