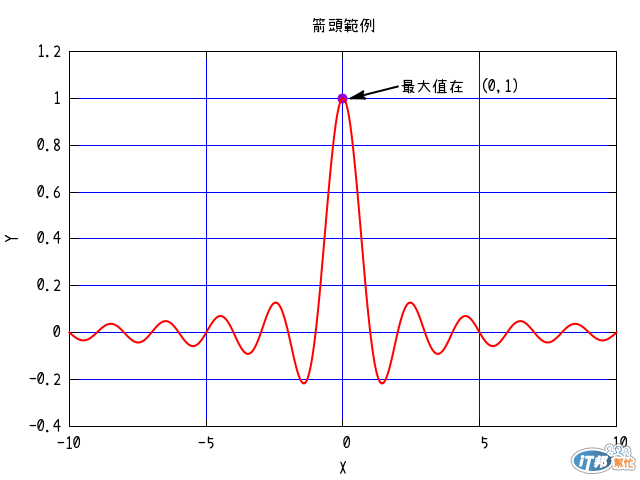
有時候需要使用箭頭來提示.
今天的範例就使用了箭頭,加上文字label來說明.
並且在最大值處畫個醒目的點,我們使用了色碼,
來指定顏色.
而且指定了比較萌一點的字型.
指令如下:
set term pngcairo font "SetoFont"
set output "p1011a.png"
sinc(x) = sin(pi * x) / (pi * x)
set xlabel "X"
set ylabel "Y"
set yrange [-0.4:1.2]
set title "箭頭範例"
unset key
set sample 500
set arrow 1 from 2,1.05 to 0.3,1 filled size 0.5,15,60 lw 2
set label 1 at 0,1 point pt 7 ps 1.5 lc rgb "#9400D3"
set label 2 "最大值在  (0,1) " at 2.1, 1.05
set grid back ls 12
plot sinc(x) lw 2


 iThome鐵人賽