進入互動模式:
unset key
f(x,y)=sin(sqrt(x*x+y*y))/sqrt(x*x+y*y)
set xlabel "X"
set ylabel "Y"
set zlabel "Z"
set ztics 1
splot f(x,y)
這樣先繪圖出來
使用滑鼠調整到適當視角,參考圖形:
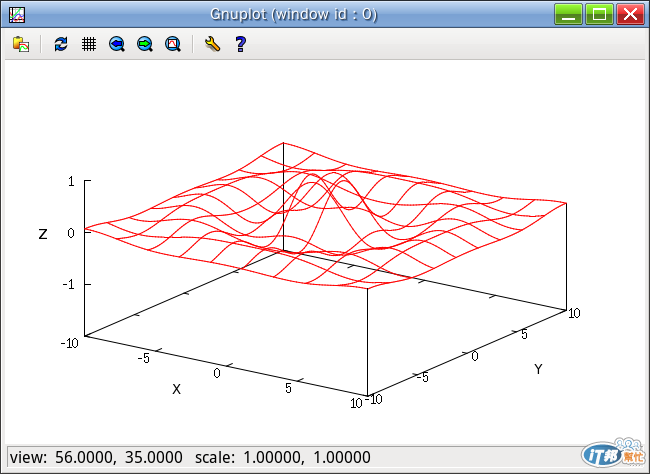
注意到 view: 後面兩個數字,這代表視角.
接著再輸入:
set view 56,35
set term pngcairo font "Anonymous Pro"
set output "p1013a.png"
replot
這樣就輸出成png檔.因為都上面的類似,就不上傳.
既然抓到視角了.
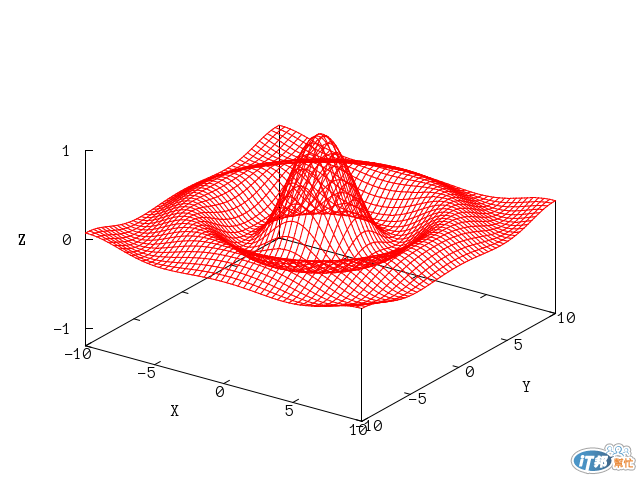
接著重新繪製新的,同時讓網格密一點,也將下面空白減少一些.
unset key
set term pngcairo font "Anonymous Pro"
set output "p1013b.png"
f(x,y)=sin(sqrt(x*x+y*y))/sqrt(x*x+y*y)
set xlabel "X"
set ylabel "Y"
set zlabel "Z"
set ztics 1
set isosamples 50
set xyplane 0.1
splot f(x,y)
結果如:
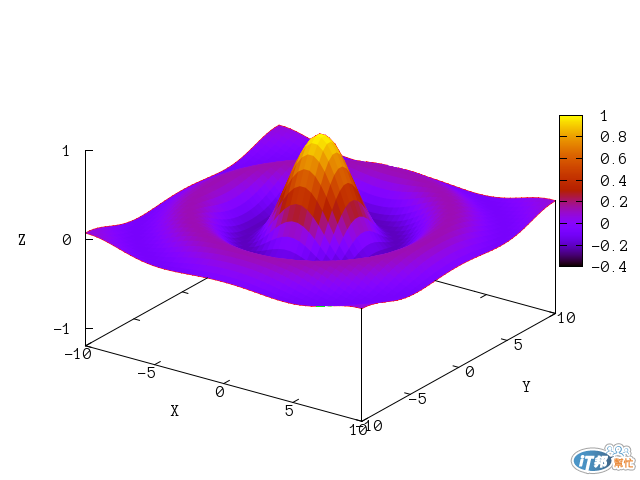
接著將後面部份隱藏,並改用彩色繪製.
unset key
set term pngcairo font "Anonymous Pro"
set output "p1013c.png"
f(x,y)=sin(sqrt(x*x+y*y))/sqrt(x*x+y*y)
set xlabel "X"
set ylabel "Y"
set zlabel "Z"
set ztics 1
set isosamples 50
set hidden3d
set xyplane 0.1
set pm3d
splot f(x,y)
繪製圖形如:
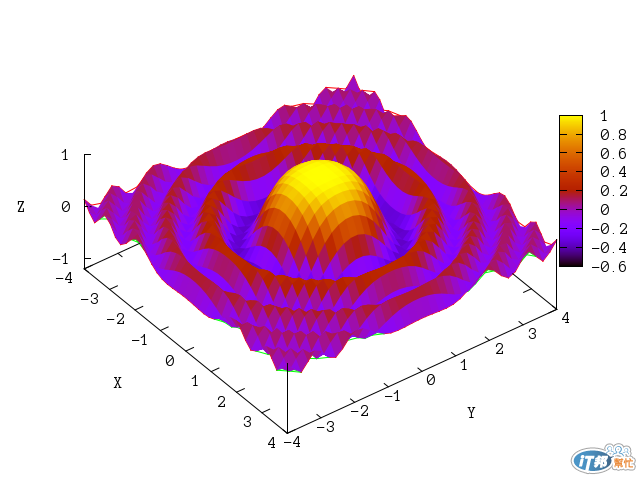
再來看另一個例子
unset key
set term pngcairo font "Anonymous Pro"
set output "p1013d.png"
unset key
set xrange [-4:4]
set yrange [-4:4]
set ztics 1
set isosamples 40
set view 29,53
set hidden3d
set pm3d
splot besj0(x**2+y**2)
圖形如:


 iThome鐵人賽