這章先介紹一下Grafana這個好用的儀表板
Grafana有許多plugins,可以做許多服務的儀表板,例如Elasticsearch(收集log的好工具,後面會介紹),用來替代Kibana顯示儀表
https://grafana.com/plugins
下載位置(2018/2/1)
https://grafana.com/grafana/download
yum install https://s3-us-west-2.amazonaws.com/grafana-releases/release/grafana-4.6.3-1.x86_64.rpm
systemctl enable grafana-server
systemctl start grafana-server
預設開3000 port,網頁輸入ServerIP:3000 ,帳密admin/admin
firewall-cmd --permanent --add-port=3000/tcp
firewall-cmd --reload
systemctl restart firewalld
zabbix插件要額外安裝,參考官網教學,安裝完後要至Plungs => APPS內選zabbix Enable
https://grafana.com/plugins/alexanderzobnin-zabbix-app/installation
grafana-cli plugins install alexanderzobnin-zabbix-app
systemctl restart grafana-server

登入後點選左上角Data Sources => Add data source (連接Zabbix的API)
Type => zabbix
Url => http://127.0.0.1/zabbix/api_jsonrpc.php
Username => Admin
Password => zabbix

#新功能:設定前加上zabbix sql,長時間數據時會到database取值加速顯示
驗證通過後點選左上角Dashboards => New => Graph
點下panel Title 位置出現選點,選擇Edit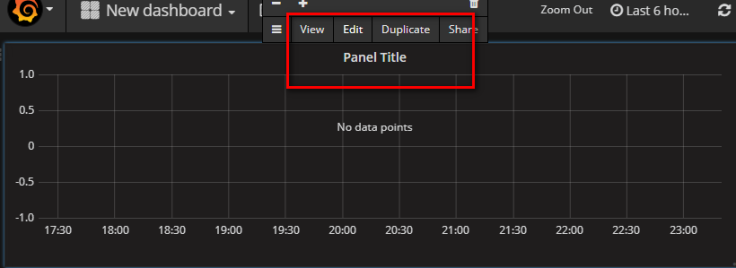
Data Source 選擇之前建的
Group, Host, Application,item對應zabbix的分類 (皆可以下拉選擇), /CPU/ 為正規表示式,顯示有CPU關鍵字
#zabbix的分類在下一章1-4章再說明
點選Axes => Unit 可選擇單位,我們知道CPU單位為percent 0~100,選擇後顯示單位了
點選Legend,As Table 顯示平均,最大值及目前值
滑鼠去點顏色線可以改顏色
Display 可以改成顯示點,Stack勾選甚至能產生堆疊圖
細部還有很多參數能調,進階應用可以參考以下連結,有很多Demo樣板,或去Google爬文
http://play.grafana-zabbix.org/dashboard/db/grafana-zabbix-demo?orgId=2


 iThome鐵人賽