最後一篇
目標在常態圖上標上我的目標點
假設這一點 z值是1.96
a1 = 1.96
a2 = dnorm(1.96)
t1 = data.frame(x = a1 , y = a2)
接下來就將上方的data.frame的點加入到前方的ggplot中
ggplot(data.frame(x = random , y = density),aes(x = random , y = density)) +
  geom_line(size = 1) +
  geom_point(data = t1,aes(x = a1, y = a2),col = "red" , size = 3)+
  labs(x = "Z值" , y = "機率分佈")+
  theme(panel.background=element_rect(fill='white', color="white",col = "white"))+## #cc9999背景顏色
  theme(plot.background = element_rect("white"))
那如果要加上範圍的話
可以使用geom_polygon來做圖
首先先設計data.frame
pos_x = seq(from = min(random),to = a1 , by = .0001)
pos_y = dnorm(pos_x)

pos_com = data.frame(x = pos_x , y = pos_y)

pos_com = rbind(c(min(pos_x),0),pos_com,c(a1,0))
設計完之後 , 同樣的把data.frame加到ggplot中
ggplot(data.frame(x = random , y = density),aes(x = random , y = density)) +
  geom_polygon(data = pos_com , aes(x = x , y = y))+
  geom_line(size = 1) +
  geom_point(data = t1,aes(x = a1, y = a2),col = "red" , size = 3)+
  labs(x = "Z值" , y = "機率分佈")+
  theme(panel.background=element_rect(fill='white', color="white",col = "white"))+## #cc9999背景顏色
  theme(plot.background = element_rect("white"))
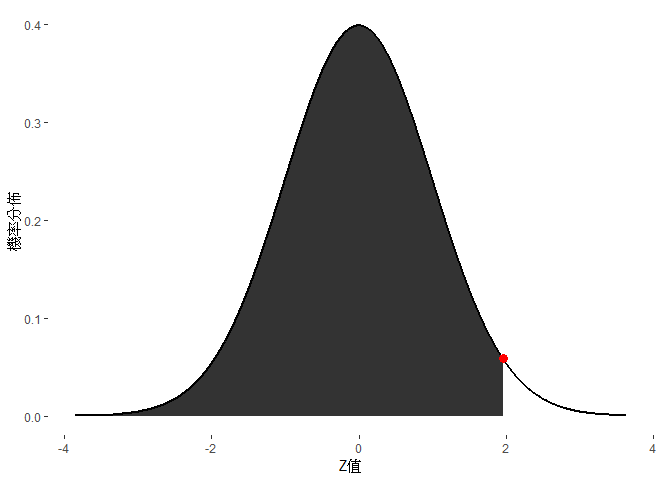
完成!!!
終於寫完30篇了......
今年真的感到異常得疲倦阿.....XD
但還是恭喜我自己堅持到底拉!!
yaaaaaaaaaaaaaaaaaaaaaaaaaaaaaaaaaaaaaaaaaaaaaaaaaaa


 iThome鐵人賽