進入倒數兩天~
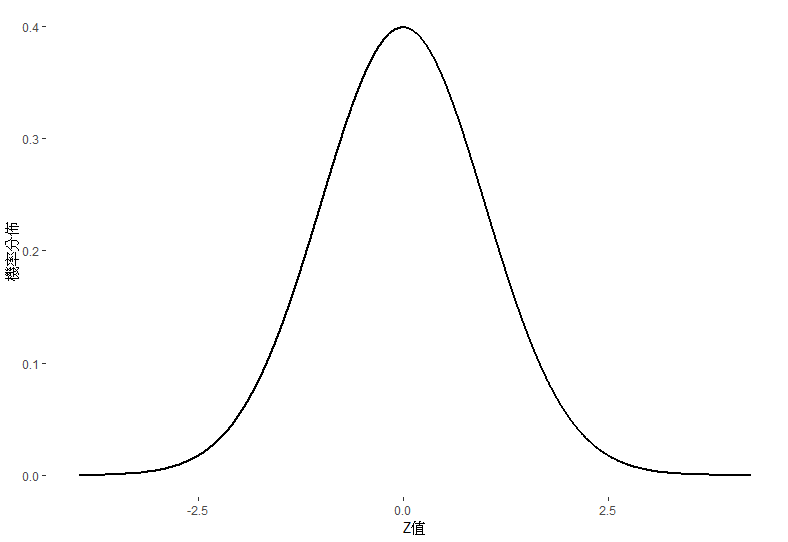
今天要寫的是如何畫出常態分布圖
首先我們先取隨機的數字
rnorm(n,mean,sd)
如不指定mean 以及 sd 將為預設值mean = 0 , sd = 1
random = rnorm(30000,0,1)
接下來我們用dnorm取機率密度
density = dnorm(random)
接著很簡單 , 只要將資料放進 ggplot中即可繪圖
ggplot(data.frame(x = random , y = density),aes(x = random , y = density)) +
  geom_line(size = 1) +
  labs(x = "Z值" , y = "機率分佈")+
  theme(panel.background=element_rect(fill='white', color="white",col = "white"))+## #cc9999背景顏色
  theme(plot.background = element_rect("white"))

以上為畫出常態分配的方式!
