GRAFANA版本:V6.4.4
MariaDB版:10.4
沒想到我的人生,走到了毫秒必爭的階段!
使用Grafana大約一年的時間,十分喜愛這套美觀大方的軟件,那日突然需要觀察五秒內作動的設備電壓電流變化,感測器每秒大約有100筆資料的產出,怎麼調整Grafana參數都只能顯示一秒間格的解析度,爬遍中外討論區仍無答案。
後來,靈機一動,找到了解決方法,在這裡分享給大家。
一.選擇DATASOURCE。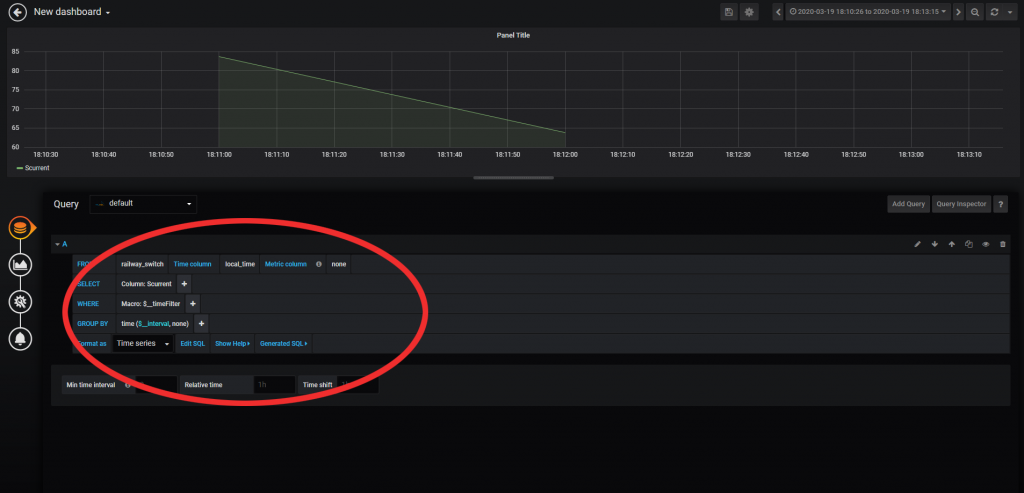
二.變更為編輯模式(1),並產生SQL程式碼(2)。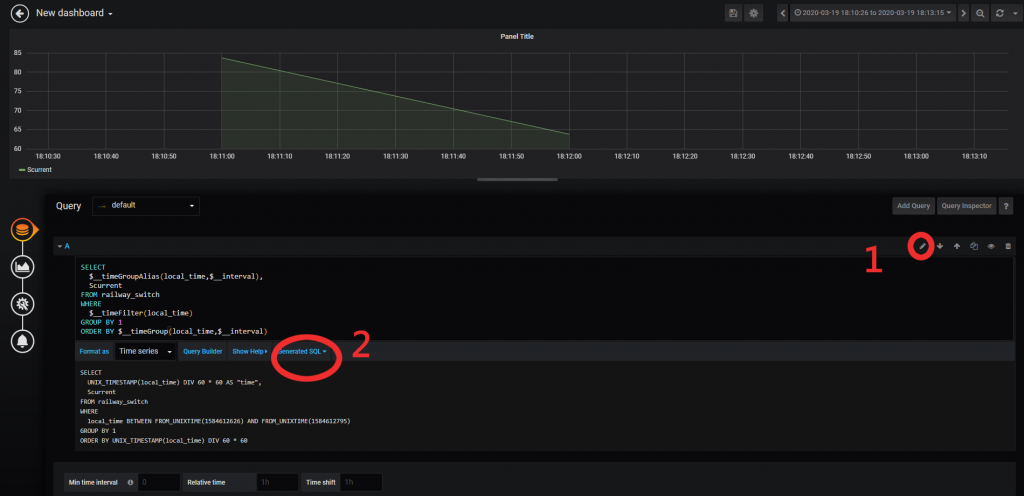
三.複製SQL程式碼,並貼至編輯區。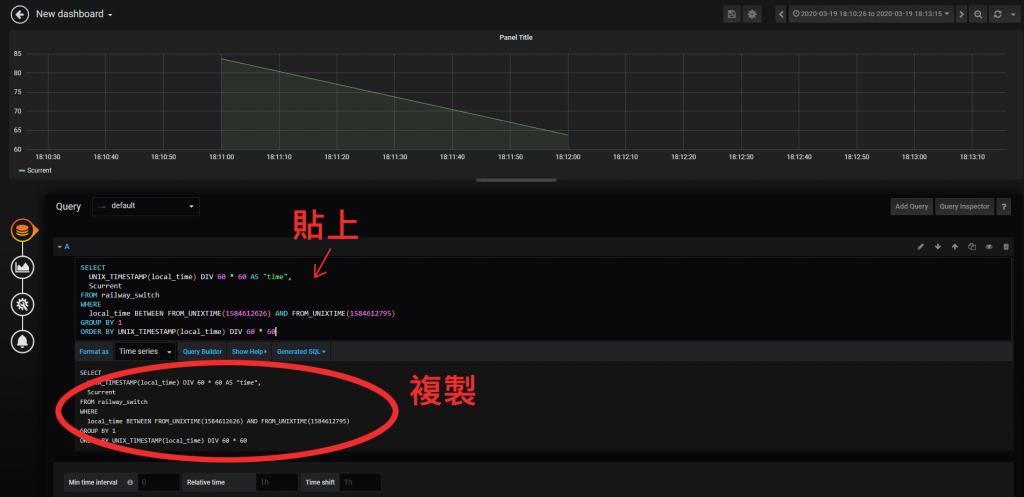
四.修改DIV為0.01 * 0.01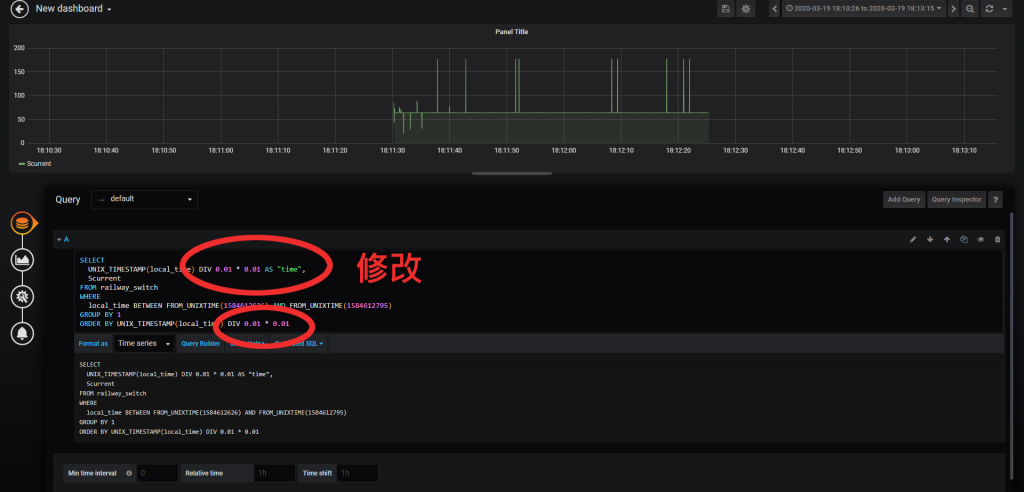
五.調整Draw Modes的Points為開啟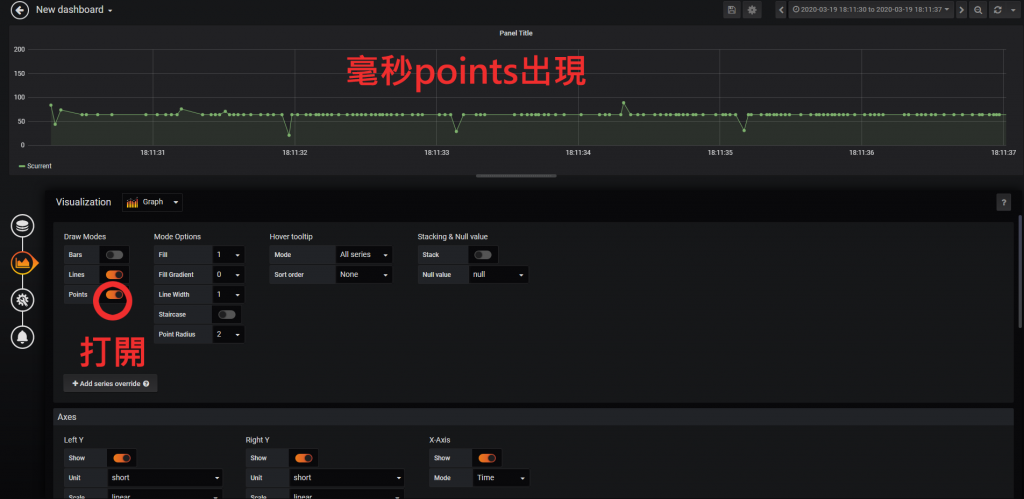
大功告成,是不是很容易?
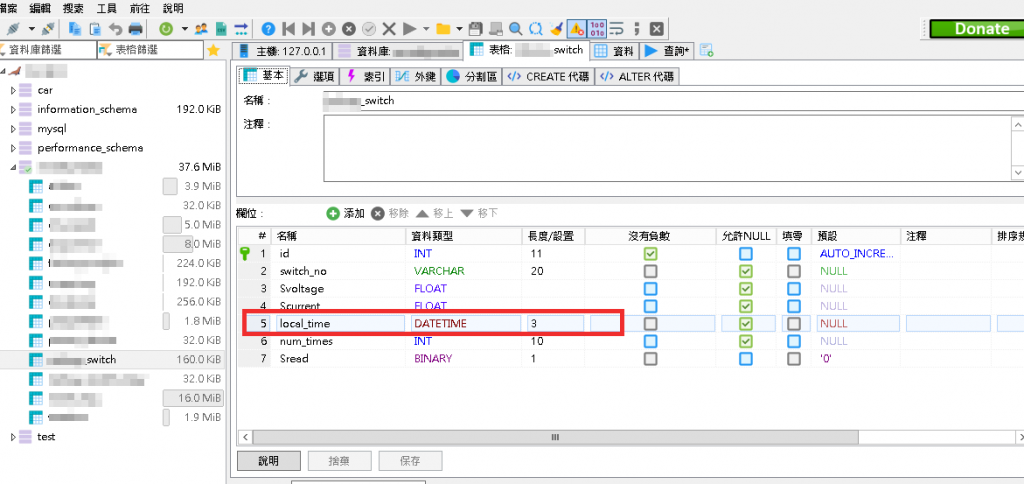
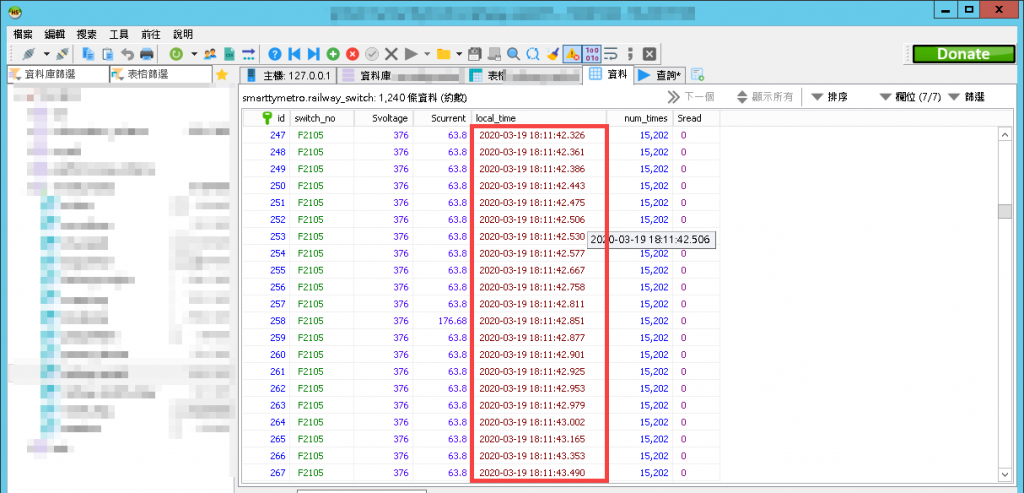
另外,DATABASE必須設定為能夠儲存毫秒的欄位,請參考以下設定。
若喜歡本文章,請給予鼓勵鼓勵!
 mango_tony
