使用 Pro Components 製作圖表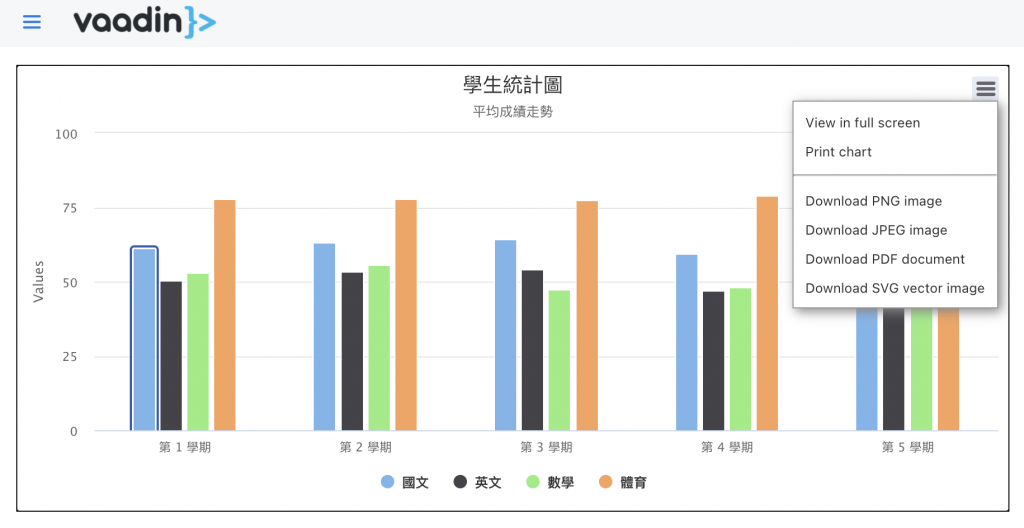
螢幕截圖
匯出png圖
Vaadin Charts 是 Vaadin Pro 訂閱的一部份,屬付費功能 (收費標準),Vaadin 提供 14 天免費試用,具學生身份者可透過 GitHub Student Developer Pack 免費使用付費功能。
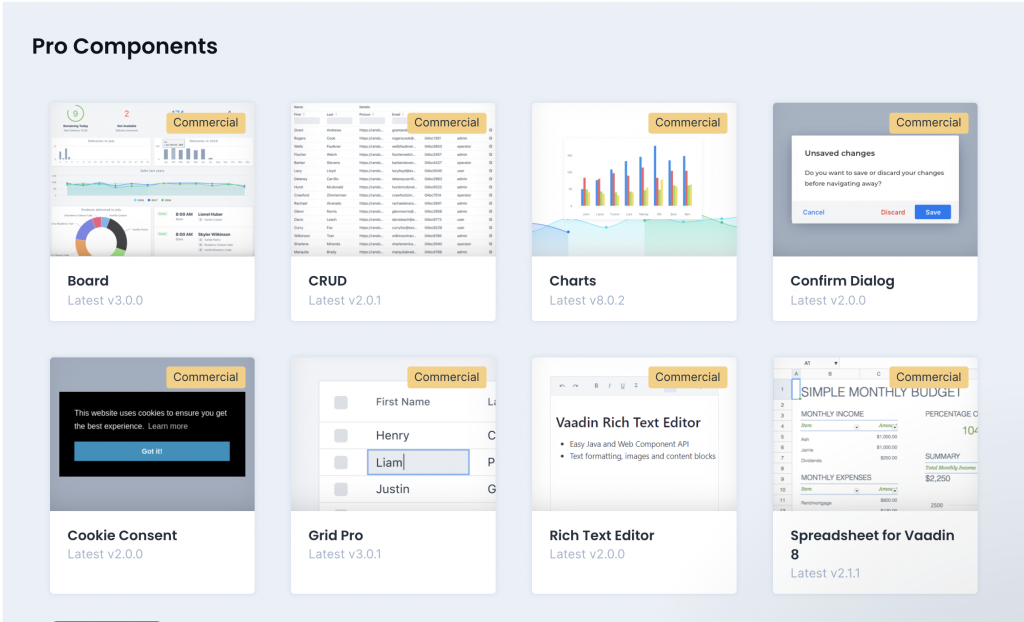
若有商業需求,付費版的組件可大大節省開發時間,其實還是相當划算的。
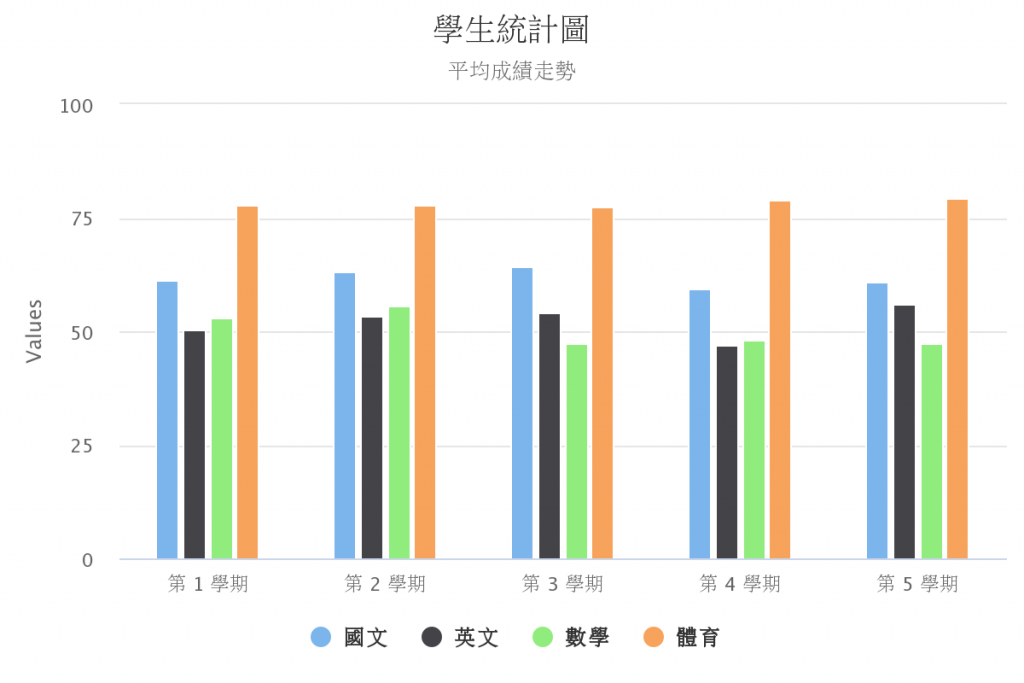
製作圖表最重要的是先思考這張圖的目的是什麼,再決定以什麼方式呈現。此測試案例裡,筆者希望:
所以選定以長條圖展示,接著要產出資料了。
前例中,學生成績資料表如下 :
 create TABLE Grade(
     id bigint auto_increment PRIMARY KEY,
     mandarin DOUBLE NOT NULL,
     description VARCHAR(50) NOT NULL,
     english DOUBLE NOT NULL,
     math DOUBLE NOT NULL,
     pe DOUBLE NOT NULL,
     student_id bigint not null REFERENCES Student(id)
 )
從學生成績資料表Grade以學期分群計算各科平均,小數點計算到小數2位,得出結果 List<GradeStatistics>
data class GradeStatistics(
    var description: String? = null,
    var range: String? = null,
    var a_english: Double? = null,
    var a_math: Double? = null,
    var a_mandarin: Double? = null,
    var a_pe: Double? = null

) {
    companion object {
        fun getStatistics(): List<GradeStatistics> = db {
            handle.createQuery("select description, round(AVG(english),2) as a_english, round(AVG(math),2) as a_math, round(AVG(mandarin),2) as a_mandarin, round(AVG(pe),2) as a_pe from grade group by description")
                .mapToBean(GradeStatistics::class.java)
                .list()
        }
    }
}
implementation("com.vaadin:vaadin-charts-flow:21.0.2")
val list = GradeStatistics.getStatistics()
val chart  = Chart(ChartType.COLUMN)
val conf = chart.configuration
with(conf){
    title = Title("學生統計圖")
    subTitle = Subtitle("平均成績走勢")
    isExporting = true
}
將學期做為X軸,setCategories()傳入參數為字串陣列或字串組
val x = XAxis()
x.setCategories(*list.map { it.description }.toTypedArray())
conf.addxAxis(x)
每組長條圖有4欄,分別為國文、英文、數學、體育成績,以下一一將資料填入
var dataSeries = DataSeries()
var poltOption = PlotOptionsColumn()
with(dataSeries){
    plotOptions = poltOption
    name = "國文"
    setData(*list.map { it.a_mandarin }.toTypedArray())
}
conf.addSeries(dataSeries)

dataSeries = DataSeries()
poltOption = PlotOptionsColumn()
with(dataSeries){
    plotOptions = poltOption
    name = "英文"
    setData(*list.map { it.a_english }.toTypedArray())
}
conf.addSeries(dataSeries)

dataSeries = DataSeries()
poltOption = PlotOptionsColumn()
with(dataSeries){
    plotOptions = poltOption
    name = "數學"
    setData(*list.map { it.a_math }.toTypedArray())
}
conf.addSeries(dataSeries)

dataSeries = DataSeries()
poltOption = PlotOptionsColumn()
with(dataSeries){
    plotOptions = poltOption
    name = "體育"
    setData(*list.map { it.a_pe }.toTypedArray())
}
conf.addSeries(dataSeries)
完成設定後將chart加入ui
val plotOptions = PlotOptionsLine()
plotOptions.marker = Marker(false)
conf.setPlotOptions(plotOptions)
add(chart)
本示例由程式自動產生100筆學生資料,各5個學期成績,分數區間如下 :