Lab2作業需求: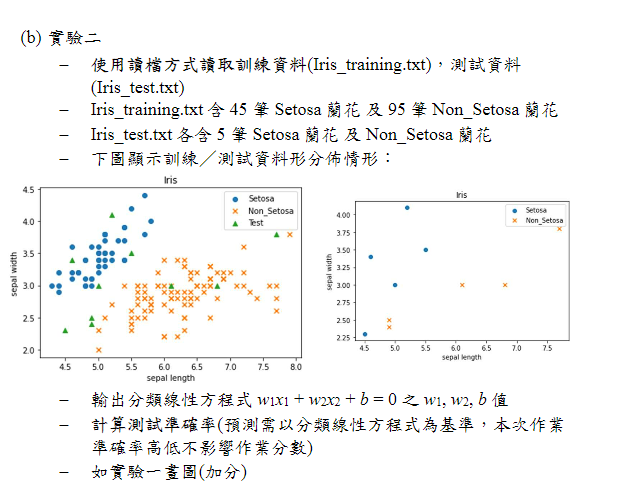
基本上和Lab大同小異,唯一要改的地方就是讀取檔案的部分:
from matplotlib import markers
import numpy as np
import matplotlib.pyplot as plt

# 分割資料


def getDataSet(filename):
    dataSet = open(filename, 'r')
    dataSet = dataSet.readlines()
    num = len(dataSet)
    x1 = np.zeros((num, 1))
    x2 = np.zeros((num, 1))
    y = np.zeros((num, 1))
    for i in range(num):
        data = dataSet[i].strip().split(",")
        x1[i] = float(data[0])
        x2[i] = float(data[1])
        y[i] = float(data[2])
    return num, x1, x2, y


def pla_with_data(num, x1, x2, y):

    # 初始值 >> w=[0,0] b=0
    w = np.zeros((2, 1))
    b = 0
    flag = 1

    for k in range(100):   # 限制無窮迴圈 >> 次數設定100次
        flag = 1
        for i in range(num):     # 看每個點是否為正確

            dot = x1[i]*int(w[0])+x2[i]*int(w[1])   # 將一個點的座標帶入 跟w作內積
            if sign(dot, b) != y[i]:  # 與參考資料y不相符 >> 線劃分錯誤

                flag = 0
                w[0] += y[i] * x1[i]    # 矯正 w = w + y*x
                w[1] += y[i] * x2[i]
                b = b + y[i]            # 矯正 b = b + y
                #print(w, b)

            else:
                continue  # 與參考資料y相符 >> 下一個點

        if flag == 1:
            break  # 全部的點都與參考資料y相符 >> 劃分完成

    return w, b


def sign(dot, b):
    if dot+b >= 0:
        return 1
    else:
        return -1

# 畫圖


def draw(x1, x2, y, prex1, prex2):

    # 製作figure
    fig = plt.figure()

    # 圖表的設定
    ax = fig.add_subplot(1, 1, 1)

    # 散佈圖
    for i in range(num):
        if y[i] == 1:
            ax.scatter(x1[i], x2[i], color='red')
        else:
            ax.scatter(x1[i], x2[i], color='black')

    for i in range(prenum):
        ax.scatter(prex1[i], prex2[i], color='green', marker="x")

    plt.show()

# 先讀取訓練資料
filename = r"Iris_training.txt"
num, x1, x2, y = getDataSet(filename)

# 把資料帶入模型
w, b = pla_with_data(num, x1, x2, y)

# 再讀取要預測的資料
filename = r"Iris_test.txt"
prenum, prex1, prex2, prey = getDataSet(filename)

# 輸出預測結果
predict = 0
for i in range(prenum):
    pre = np.sign((prex1[i]*w[0]+prex2[i]*w[1])+b)
    if pre != prey[i]:
        predict += 1
    print('predict example %s = %s' % (i+1, pre))

print('error = %s / %s ' % (predict, prenum))
print('w1 = %s , w2 = %s , b = %s' % (w[0], w[1], b))
draw(x1, x2, y, prex1, prex2)
畫圖真的是弱項...另一半是因為偷懶 :)
結果圖: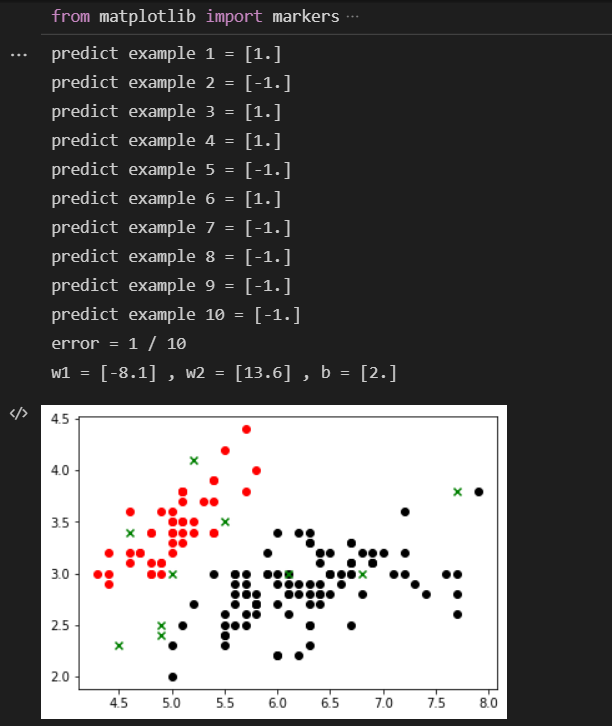
github連結:
https://github.com/Minimindy/PLA-numpy-only-/tree/main
 minimindy

 iThome鐵人賽