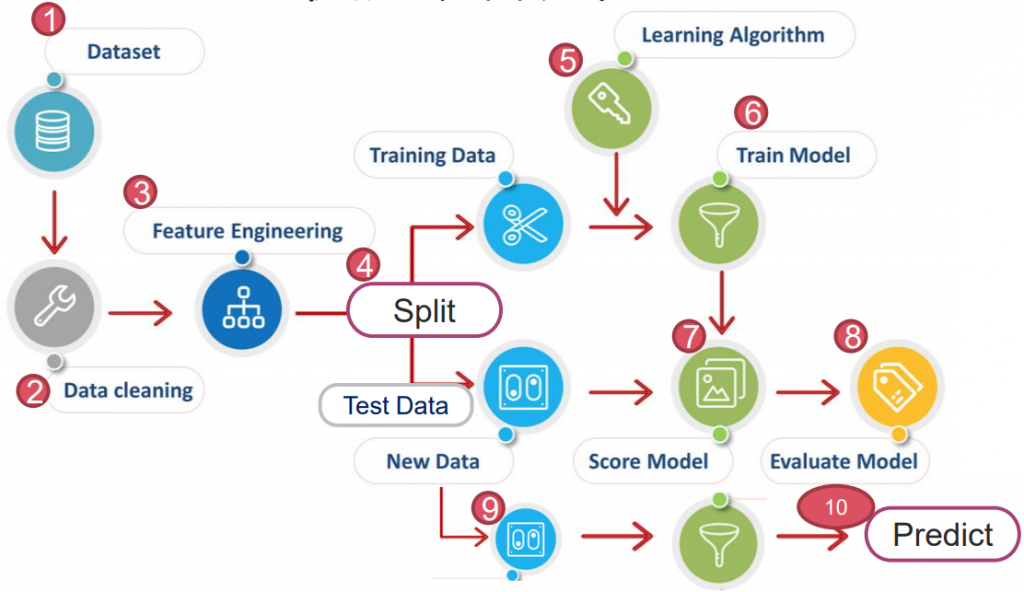
https://yourfreetemplates.com/free-machine-learning-diagram/
同特徵選擇,特徵萃取一樣有幾種方式。以下介紹 PCA、LDA & Kernal PCA
為非監督式學習(不需要有 Y),可線性分離。
將原數據轉換,投影到較低維度的特徵空間,使該座標軸保留最多資訊為前提的壓縮方式。
因為其非監督式學習的特性,對於預測資料來說泛用度較高,是大企業常用的工具。
*下圖為例,將 x1+ x2 轉換為 PC1 + PC2。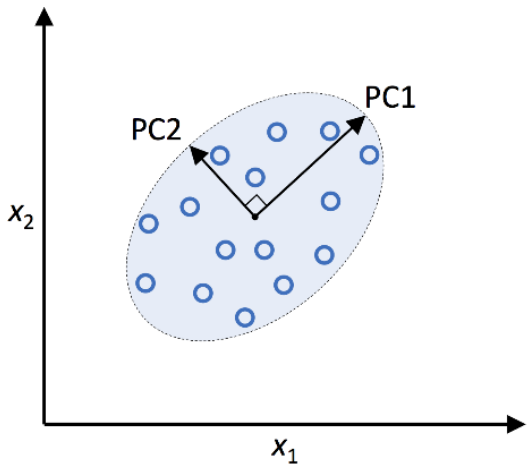
以下使用 wine 作為範例:
# 1. Datasets
import pandas as pd

df_wine = pd.read_csv('https://archive.ics.uci.edu/ml/'
                      'machine-learning-databases/wine/wine.data',
                      header=None)
df_wine.columns = ['Class label', 'Alcohol', 'Malic acid', 'Ash',
                   'Alcalinity of ash', 'Magnesium', 'Total phenols',
                   'Flavanoids', 'Nonflavanoid phenols', 'Proanthocyanins',
                   'Color intensity', 'Hue',
                   'OD280/OD315 of diluted wines', 'Proline']

df_wine.head()

# 定義 y
df_wine['Class label'].value_counts()

>>  2    71
    1    59
    3    48
    Name: Class label, dtype: int64

# 2. Clean Data
# 不需要

# 3. Split Data
# 拆 30% 出來作測試資料
from sklearn.model_selection import train_test_split
X, y = df_wine.iloc[:, 1:].values, df_wine.iloc[:, 0].values

X_train, X_test, y_train, y_test = train_test_split(X, y, test_size=0.3, stratify=y, random_state=0)

4-1. Standardlization
from sklearn.preprocessing import StandardScaler

sc = StandardScaler()
X_train_std = sc.fit_transform(X_train)
X_test_std = sc.transform(X_test)

# 有 13 個特徵
X_train_std.shape, X_test_std.shape

>>  ((124, 13), (54, 13))
(自行開發 PCA 見補充 1.)
from sklearn.decomposition import PCA

pca1 = PCA()
X_train_pca = pca1.fit_transform(X_train_std)
eigen_vals = pca1.explained_variance_ratio_
eigen_vals

>>  array([0.36951469, 0.18434927, 0.11815159, 0.07334252, 0.06422108,
           0.05051724, 0.03954654, 0.02643918, 0.02389319, 0.01629614,
           0.01380021, 0.01172226, 0.00820609])
使用權重 w = 2 項
pca2 = PCA(n_components=2)
X_train_pca = pca2.fit_transform(X_train_std)
X_test_pca = pca2.transform(X_test_std)

X_train_pca.shape, X_test_pca.shape
>>  ((124, 2), (54, 2))
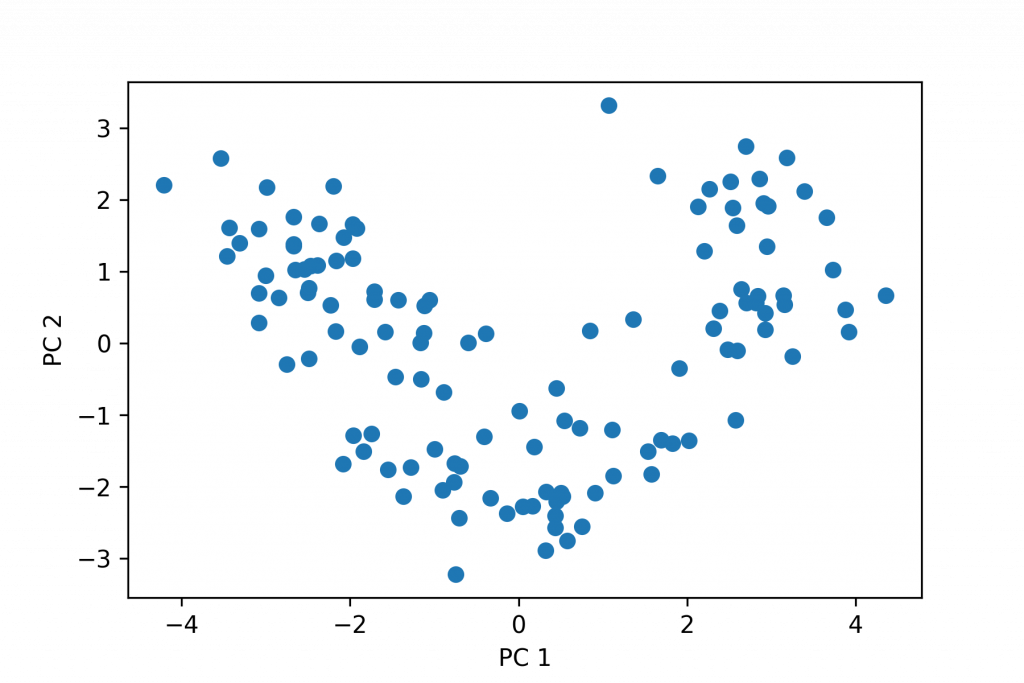
作圖
plt.scatter(X_train_pca[:, 0], X_train_pca[:, 1])
plt.xlabel('PC 1')
plt.ylabel('PC 2')

plt.show()
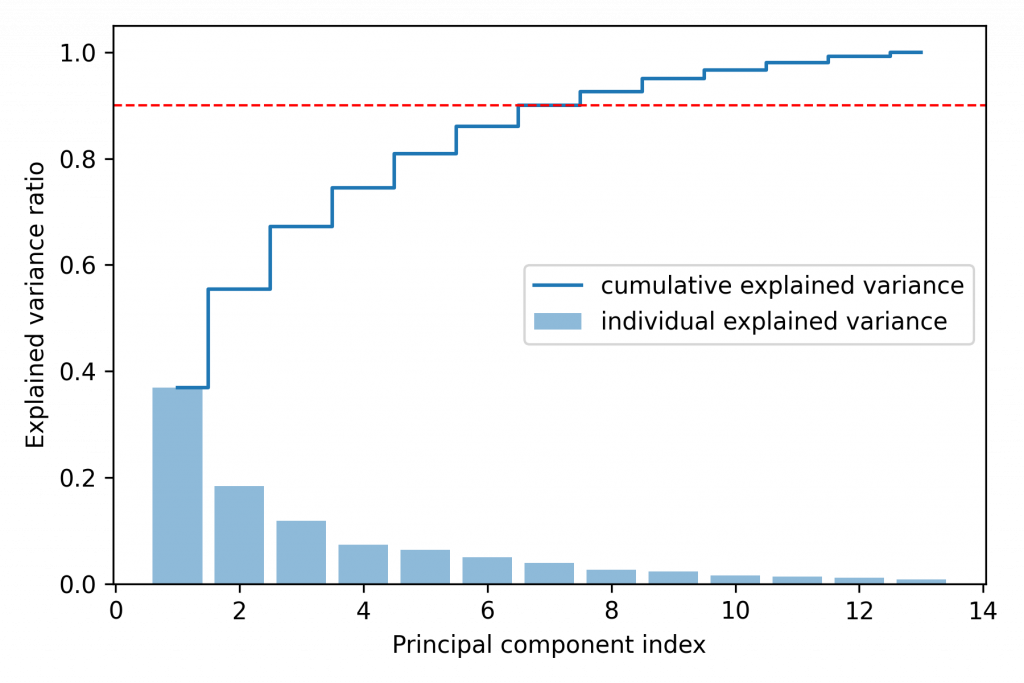
也可以指定若要達到 90% 覆蓋率,要取多少項
pca5 = PCA(0.9)
X_train_pca = pca5.fit_transform(X_train_std)
pca5.explained_variance_ratio_
PS. 只是這樣就沒辦法畫出圖片了~畢竟維度提升到了 5 維。
是一種監督式學習(需要有 Y),也可線性分離。
因為為監督式,故在求取「類別內散布矩陣(Sw)」望小,「類別外散布矩陣(Sb)」則望大。
類似 PCA,也有降冪排序。
圖中藍圈內部為 Sw,藍圈與黃圈互為 Sb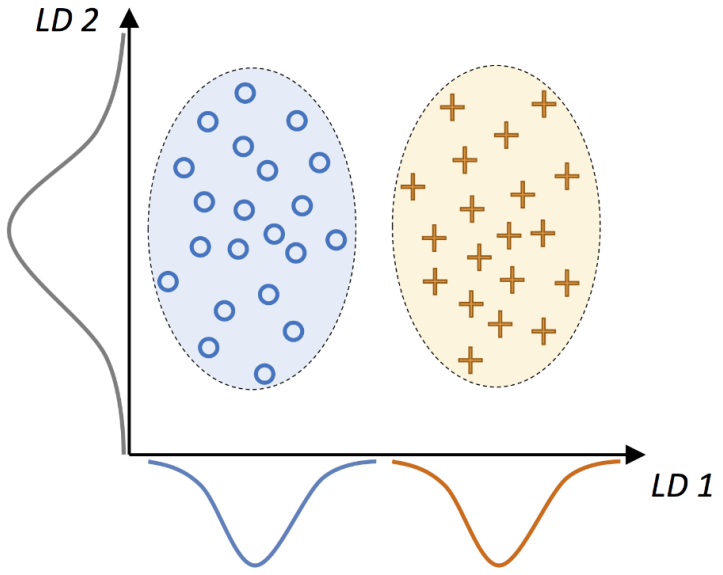
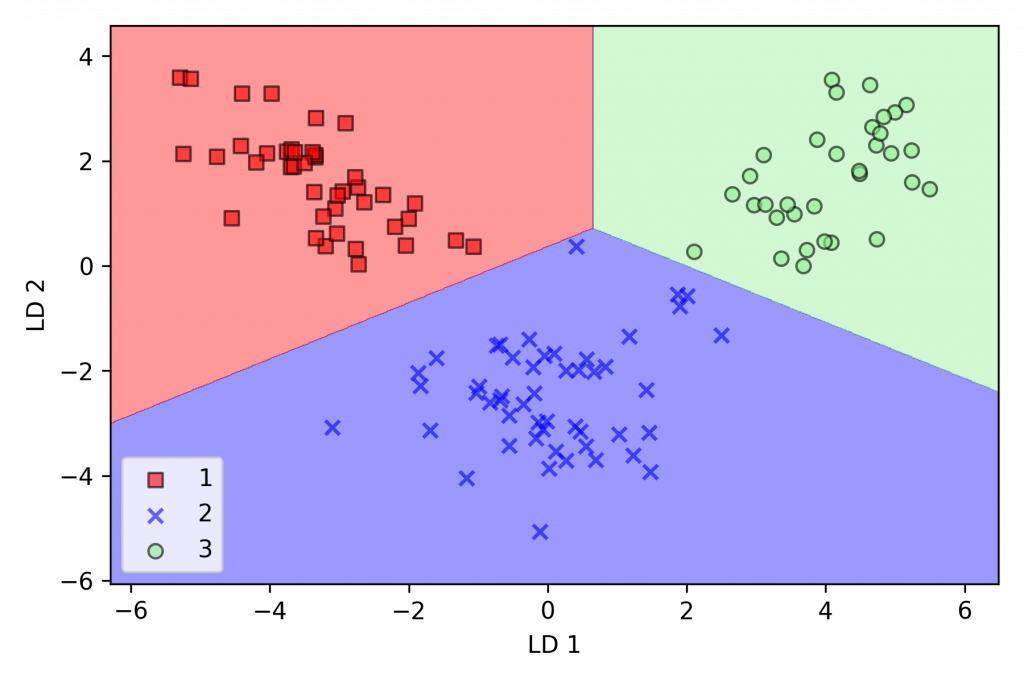
我們沿用上面 wine 的前處理,直接從使用 LDA 開始。
(自行開發 LDA 見補充 2.)
from sklearn.discriminant_analysis import LinearDiscriminantAnalysis as LDA

lda = LDA(n_components=2)
X_train_lda = lda.fit_transform(X_train_std, y_train)
接著選用一個演算法來評分:
# LDA 畫 train data 圖
from sklearn.linear_model import LogisticRegression
lr = LogisticRegression()
lr = lr.fit(X_train_lda, y_train)

plot_decision_regions(X_train_lda, y_train, classifier=lr)
plt.xlabel('LD 1')
plt.ylabel('LD 2')
plt.legend(loc='lower left')
plt.tight_layout()

plt.show()
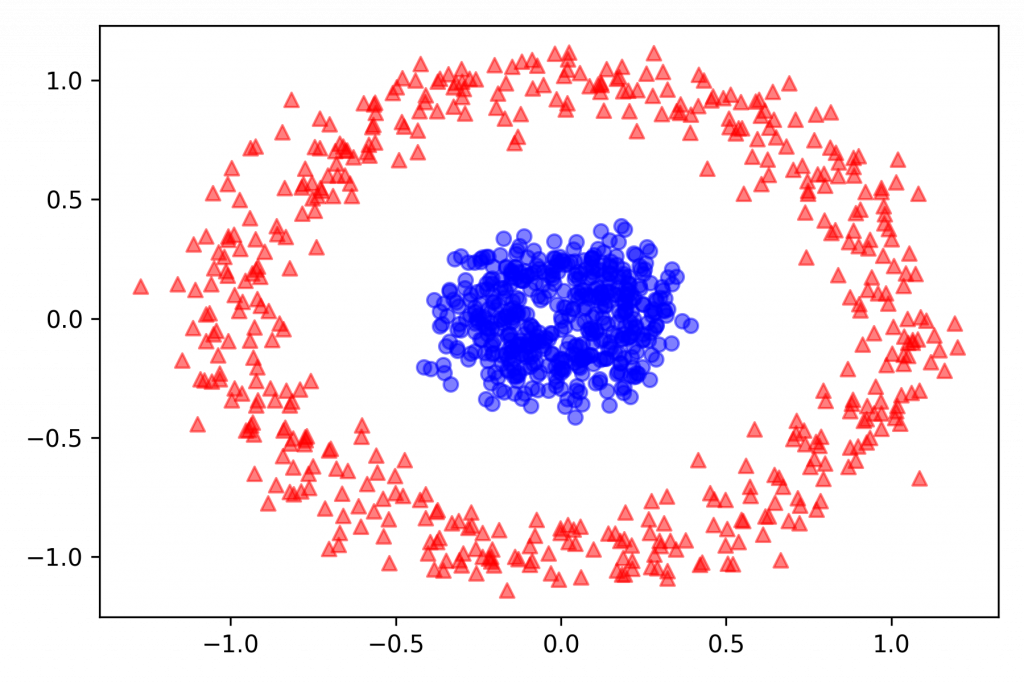
以下使用 make_circles 作為 datasets:
from sklearn.datasets import make_circles

X, y = make_circles(n_samples=1000, random_state=123, noise=0.1, factor=0.2)

plt.scatter(X[y == 0, 0], X[y == 0, 1], color='red', marker='^', alpha=0.5)
plt.scatter(X[y == 1, 0], X[y == 1, 1], color='blue', marker='o', alpha=0.5)
plt.tight_layout()

plt.show()
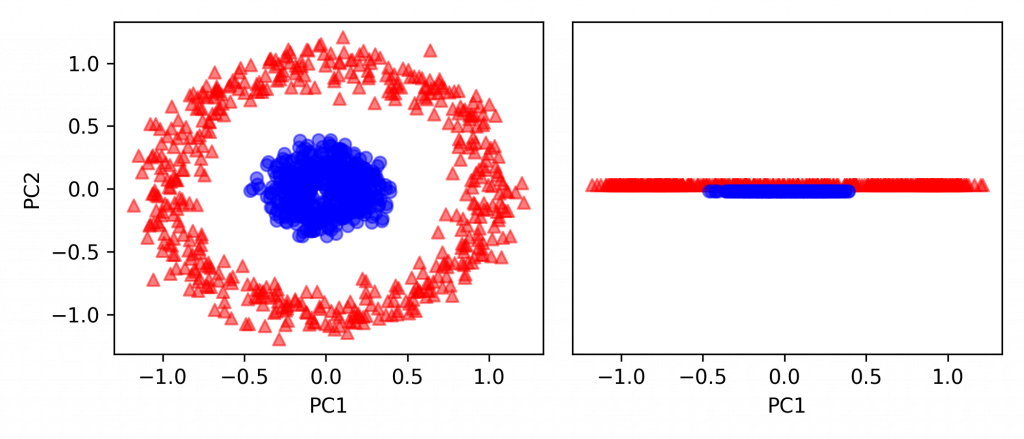
from sklearn.decomposition import PCA

scikit_pca = PCA(n_components=2)
X_spca = scikit_pca.fit_transform(X)

fig, ax = plt.subplots(nrows=1, ncols=2, figsize=(7, 3))

ax[0].scatter(X_spca[y == 0, 0], X_spca[y == 0, 1],
              color='red', marker='^', alpha=0.5)
ax[0].scatter(X_spca[y == 1, 0], X_spca[y == 1, 1],
              color='blue', marker='o', alpha=0.5)

ax[1].scatter(X_spca[y == 0, 0], np.zeros((500, 1)) + 0.02,
              color='red', marker='^', alpha=0.5)
ax[1].scatter(X_spca[y == 1, 0], np.zeros((500, 1)) - 0.02,
              color='blue', marker='o', alpha=0.5)

ax[0].set_xlabel('PC1')
ax[0].set_ylabel('PC2')
ax[1].set_ylim([-1, 1])
ax[1].set_yticks([])
ax[1].set_xlabel('PC1')

plt.tight_layout()
plt.savefig('Pic/KernalPCA (numpy) Ans02-1.png', dpi=300)

plt.show()
(自行開發 KPCA 見補充 3.)
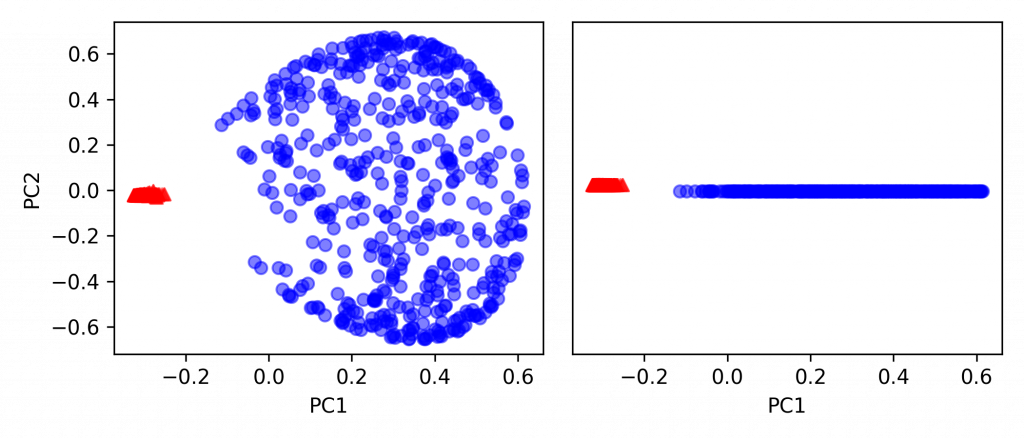
額外提下,gamma 值表示距離決策邊界越近的點的權重。
gamma 越大,決策邊界附近的點會大幅度影響決策邊界的形狀,可能導致 overfitting。
PS. 此處有 KPCA gamma 值的影片。
from sklearn.decomposition import KernelPCA

# kernel: 'linear'=線性,即 PCA。'poly'=多項式。'rbf'=以半徑當基準。'sigmoid'=邏輯式迴歸。
# n_components: 降維至多少維度。
# gamma: Kernel coefficient for linear, poly, rbf or sigmoid。
clf = KernelPCA(kernel='rbf', n_components=2, gamma=15)
X_kpca2 = clf.fit_transform(X)

fig, ax = plt.subplots(nrows=1,ncols=2, figsize=(7,3))
ax[0].scatter(X_kpca2[y == 0, 0], X_kpca2[y == 0, 1],
              color='red', marker='^', alpha=0.5)
ax[0].scatter(X_kpca2[y == 1, 0], X_kpca2[y == 1, 1],
              color='blue', marker='o', alpha=0.5)

ax[1].scatter(X_kpca2[y == 0, 0], np.zeros((500, 1)) + 0.02,
              color='red', marker='^', alpha=0.5)
ax[1].scatter(X_kpca2[y == 1, 0], np.zeros((500, 1)) - 0.02,
              color='blue', marker='o', alpha=0.5)

ax[0].set_xlabel('PC1')
ax[0].set_ylabel('PC2')
ax[1].set_ylim([-1, 1])
ax[1].set_yticks([])
ax[1].set_xlabel('PC1')

plt.tight_layout()

plt.show()
 .
.
在 3 種資料萃取的方法中,PCA 最泛用,可以處理大部分的資料轉換。
LDA 則是 PCA 強化版,但條件嚴苛。
實作中常遇到沒收集到齊全的 Y,即使有,也可能沒多餘資源去把資料一筆一筆標記上。
最後,KPCA 則可以應對較為複雜的,非線性分離(多項式、球形、邏輯迴歸)的資料類型。
.
.
.
.
.
*補充1.:
自行開發 PCA
# 取 X_train_std 的 eigenvalues & eigenvector
import numpy as np
cov_mat = np.cov(X_train_std.T)
eigen_vals, eigen_vecs = np.linalg.eig(cov_mat)

# 把 eigenvalues 依照比例排序
tot = sum(eigen_vals)

import matplotlib.pyplot as plt
# 柱狀圖
var_exp = [(i / tot) for i in sorted(eigen_vals, reverse=True)]
plt.bar(range(1, 14), var_exp, alpha=0.5, align='center', label='individual explained variance')

# 階梯圖
cum_var_exp = np.cumsum(var_exp)
plt.step(range(1, 14), cum_var_exp, where='mid', label='cumulative explained variance')

plt.ylabel('Explained variance ratio')
plt.xlabel('Principal component index')
plt.legend(loc='best')
plt.tight_layout()
plt.axhline(0.9, color='r', linestyle='--', linewidth=1)

plt.show()
# 把 eigenvalue & eigenvector 合成一個 list
eigen_pairs = [(np.abs(eigen_vals[i]), eigen_vecs[:, i]) for i in range(len(eigen_vals))]

# 由大至小排序 list
eigen_pairs.sort(key=lambda k: k[0], reverse=True)
# 為 eigen_pairs 增加一個維度,並黏合成為一個 13x2 的矩陣
w2 = np.hstack((eigen_pairs[0][1][:, np.newaxis],
                eigen_pairs[1][1][:, np.newaxis]))

print('Matrix W:\n', w2)

>>  Matrix W:
     [[-0.13724218  0.50303478]
     [ 0.24724326  0.16487119]
     [-0.02545159  0.24456476]
     [ 0.20694508 -0.11352904]
     [-0.15436582  0.28974518]
     [-0.39376952  0.05080104]
     [-0.41735106 -0.02287338]
     [ 0.30572896  0.09048885]
     [-0.30668347  0.00835233]
     [ 0.07554066  0.54977581]
     [-0.32613263 -0.20716433]
     [-0.36861022 -0.24902536]
     [-0.29669651  0.38022942]]
轉換特徵值,由 13 to 2
X_train_pca = X_train_std.dot(w2)
X_train_std.shape, X_train_pca.shape

>>  ((124, 13), (124, 2))
作圖,看看能否以 2 項權重分辨出 3 種酒類。
colors = ['r', 'b', 'g']
markers = ['s', 'x', 'o']

for l, c, m in zip(np.unique(y_train), colors, markers):
    # 把 X_train_pca 的第一項作為 x 軸,第二項作為 y 軸作圖
    x = X_train_pca[y_train == l, 0]
    y = X_train_pca[y_train == l, 1]
    print(x.shape, y.shape)

    plt.scatter(x, y, c=c, label=l, marker=m)

plt.xlabel('PC 1')
plt.ylabel('PC 2')
plt.legend(loc='lower left')
plt.tight_layout()

plt.show()
*補充 2.:
自行開發 LDA
np.set_printoptions(precision=4)

mean_vecs = []
for label in range(1, 4):
    mean_vecs.append(np.mean(X_train_std[y_train == label], axis=0))
    print('MV %s: %s\n' % (label, mean_vecs[label - 1]))

d = 13 # 原特徵數
S_W = np.zeros((d, d))
for label, mv in zip(range(1, 4), mean_vecs):
    class_scatter = np.zeros((d, d))  # scatter matrix for each class
    for row in X_train_std[y_train == label]:
        row, mv = row.reshape(d, 1), mv.reshape(d, 1)  # make column vectors
        class_scatter += (row - mv).dot((row - mv).T)
    S_W += class_scatter                          # sum class scatter matrices

print('Within-class scatter matrix: %sx%s' % (S_W.shape[0], S_W.shape[1]))
>>  Within-class scatter matrix: 13x13

d = 13  # 原特徵數
S_W = np.zeros((d, d))
for label, mv in zip(range(1, 4), mean_vecs):
    class_scatter = np.cov(X_train_std[y_train == label].T)
    S_W += class_scatter
print('Scaled within-class scatter matrix: %sx%s' % (S_W.shape[0],
                                                     S_W.shape[1]))

>>  Scaled within-class scatter matrix: 13x13

mean_overall = np.mean(X_train_std, axis=0)
d = 13  # 原特徵數
S_B = np.zeros((d, d))
for i, mean_vec in enumerate(mean_vecs):
    n = X_train[y_train == i + 1, :].shape[0]
    mean_vec = mean_vec.reshape(d, 1)  # make column vector
    mean_overall = mean_overall.reshape(d, 1)  # make column vector
    S_B += n * (mean_vec - mean_overall).dot((mean_vec - mean_overall).T)

print('Between-class scatter matrix: %sx%s' % (S_B.shape[0], S_B.shape[1]))

>>  Between-class scatter matrix: 13x13

# 為新特徵子空間選擇線性判別式
eigen_vals, eigen_vecs = np.linalg.eig(np.linalg.inv(S_W).dot(S_B))

# (eigenvalue, eigenvector) tuples
eigen_pairs = [(np.abs(eigen_vals[i]), eigen_vecs[:, i])
               for i in range(len(eigen_vals))]

# Sort (eigenvalue, eigenvector)
eigen_pairs = sorted(eigen_pairs, key=lambda k: k[0], reverse=True)

# 通過減少特徵值直觀地確認列表是否正確排序
print('Eigenvalues in descending order:\n')
for eigen_val in eigen_pairs:
    print(eigen_val[0])

>>  Eigenvalues in descending order:
    349.617808905994
    172.76152218979385
    3.478228588635107e-14
    2.842170943040401e-14
    2.0792193804944213e-14
    2.0792193804944213e-14
    1.460811844224635e-14
    1.460811844224635e-14
    1.4555923097122117e-14
    7.813418013637288e-15
    7.813418013637288e-15
    6.314269790397111e-15
    6.314269790397111e-15

# 做出權重
w = np.hstack((eigen_pairs[0][1][:, np.newaxis].real,
              eigen_pairs[1][1][:, np.newaxis].real))
print('Matrix W:\n', w)
>> Matrix W:
     [[-0.1481 -0.4092]
     [ 0.0908 -0.1577]
     [-0.0168 -0.3537]
     [ 0.1484  0.3223]
     [-0.0163 -0.0817]
     [ 0.1913  0.0842]
     [-0.7338  0.2823]
     [-0.075  -0.0102]
     [ 0.0018  0.0907]
     [ 0.294  -0.2152]
     [-0.0328  0.2747]
     [-0.3547 -0.0124]
     [-0.3915 -0.5958]]

# 作圖
X_train_lda = X_train_std.dot(w)
colors = ['r', 'b', 'g']
markers = ['s', 'x', 'o']

for l, c, m in zip(np.unique(y_train), colors, markers):
    plt.scatter(X_train_lda[y_train == l, 0],
                X_train_lda[y_train == l, 1] * (-1),
                c=c, label=l, marker=m)

plt.xlabel('LD 1')
plt.ylabel('LD 2')
plt.legend(loc='lower right')
plt.tight_layout()

plt.show()
*補充 3.:
自行開發 KPCA
from scipy.spatial.distance import pdist, squareform
from scipy import exp
from scipy.linalg import eigh
import numpy as np

def rbf_kernel_pca(X, gamma, n_components):
    """
    RBF kernel PCA implementation.

    Parameters
    ------------
    X: {NumPy ndarray}, shape = [n_samples, n_features]

    gamma: float
      Tuning parameter of the RBF kernel

    n_components: int
      Number of principal components to return

    Returns
    ------------
     X_pc: {NumPy ndarray}, shape = [n_samples, k_features]
       Projected dataset

    """
    # 計算 MxN 維數據集中的 pairwise squared Euclidean distances
    sq_dists = pdist(X, 'sqeuclidean')

    # 將 pairwise distances 轉換為 square matrix
    mat_sq_dists = squareform(sq_dists)

    # 計算 symmetric kernel matrix
    K = exp(-gamma * mat_sq_dists)

    # 將 kernel matrix 居中。
    N = K.shape[0]
    one_n = np.ones((N, N)) / N
    K = K - one_n.dot(K) - K.dot(one_n) + one_n.dot(K).dot(one_n)

    # 從 centered kernel matrix 獲得 obtaining eigenpairs
    # scipy.linalg.eigh: 按升序返還
    eigvals, eigvecs = eigh(K)
    eigvals, eigvecs = eigvals[::-1], eigvecs[:, ::-1]

    # 收集前 k 個 eigenvectors (projected samples)
    X_pc = np.column_stack((eigvecs[:, i]
                            for i in range(n_components)))

    return X_pc
X_kpca = rbf_kernel_pca(X, gamma=15, n_components=2)

fig, ax = plt.subplots(nrows=1, ncols=2, figsize=(7, 3))
ax[0].scatter(X_kpca[y == 0, 0], X_kpca[y == 0, 1],
              color='red', marker='^', alpha=0.5)
ax[0].scatter(X_kpca[y == 1, 0], X_kpca[y == 1, 1],
              color='blue', marker='o', alpha=0.5)

ax[1].scatter(X_kpca[y == 0, 0], np.zeros((500, 1)) + 0.02,
              color='red', marker='^', alpha=0.5)
ax[1].scatter(X_kpca[y == 1, 0], np.zeros((500, 1)) - 0.02,
              color='blue', marker='o', alpha=0.5)

ax[0].set_xlabel('PC1')
ax[0].set_ylabel('PC2')
ax[1].set_ylim([-1, 1])
ax[1].set_yticks([])
ax[1].set_xlabel('PC1')

plt.tight_layout()

plt.show()
.
.
.
.
.
試著用 sklearn 的資料集 breast_cancer,操作 Featuring Selection (by RandomForest)。
# Datasets
from sklearn.datasets import load_breast_cancer
import pandas as pd

ds = load_breast_cancer()

df_X = pd.DataFrame(ds.data, columns=ds.feature_names)
df_y = pd.DataFrame(ds.target, columns=['Cancer or Not'])

df_X.head()

# define y
df_y['Cancer or Not'].unique()

>>  array([0, 1])
# Split
from sklearn.model_selection import train_test_split

X_train, X_test, y_train, y_test = train_test_split(df_X, df_y, test_size=0.3)
X_train.shape, X_test.shape

>>  ((398, 30), (171, 30))
# 隨機森林演算法
from sklearn.ensemble import RandomForestClassifier
import numpy as np

rfc = RandomForestClassifier(n_estimators=500, random_state=1)
rfc.fit(X_train, y_train)

# 把每一個變數特徵的重要性列出,從大排到小
ipt = rfc.feature_importances_
ipt_sort = np.argsort(ipt)[::-1]

for i in range(X_train.shape[1]):
    print(f'{i+1:>2d}) {ds.feature_names[ipt_sort[f]]:<30s} {ipt[ipt_sort[i]]:.4f}')

>>   1) worst perimeter                0.1442
     2) worst radius                   0.1199
    ...
    ..
    .
    30) concave points error           0.0035
# 只取兩項 feature
X_train_2 = X_train[['worst radius', 'worst perimeter']]
X_test_2 = X_test[['worst radius', 'worst perimeter']]

X_train_2.shape, X_test_2.shape

>>  ((398, 2), (171, 2))
# Modeling (by LogisticRegression)
from sklearn.linear_model import LogisticRegression as lr

clf = lr(solver='liblinear')
clf.fit(X_train_2, y_train)

print(clf.score(X_test_2, y_test))

>>  0.9064327485380117
.
.
.
.
.
試著用 sklearn 的資料集 breast_cancer,操作 Featuring Extraction (by PCA)。
