iT邦幫忙

2022 iThome 鐵人賽

DAY 16
0
自我挑戰組

地圖物聯系列 第 16

帳/密 demo/demo 簡報地圖物聯網展示(V 1.8)

  • 分享至 

  • xImage
  •  

即將推出 帳/密 demo/demo:

1.一系列簡報家,快速結合物聯網,玩物聯網跟作簡報一樣簡單
2. 3D及動畫結合物聯網
展示網址如下(請用電腦看):
https://joulong.hopto.org:7777/2022/08/02/%e6%99%ba%e6%85%a7%e5%b1%8b%e5%b1%95%e7%a4%ba/
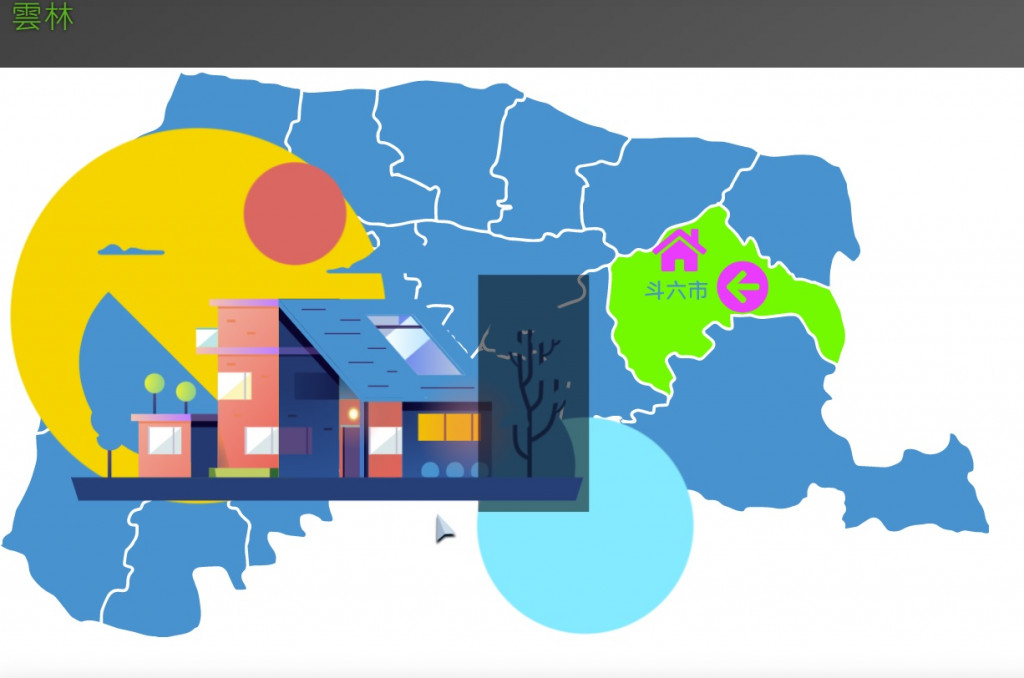
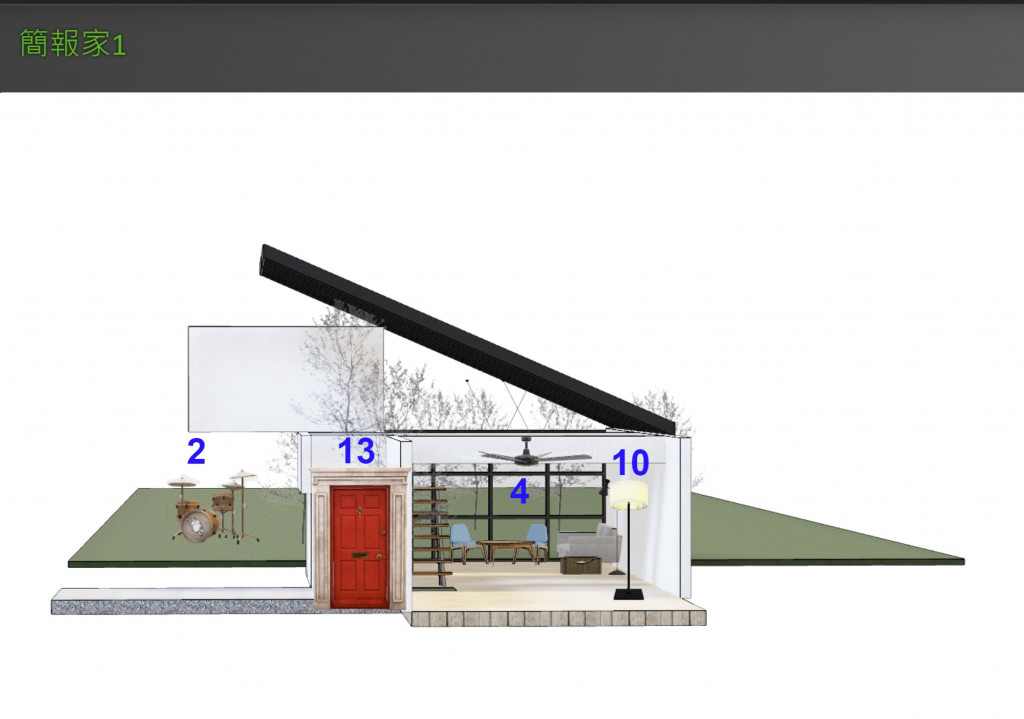
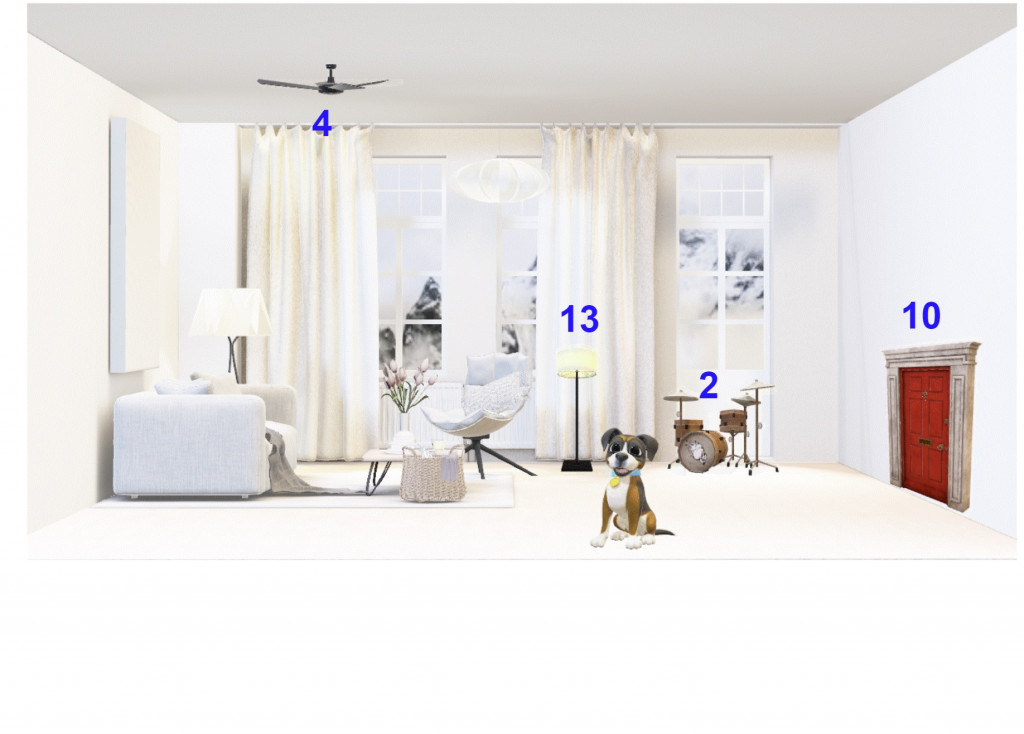
利用簡報+物聯網做出來的畫面:

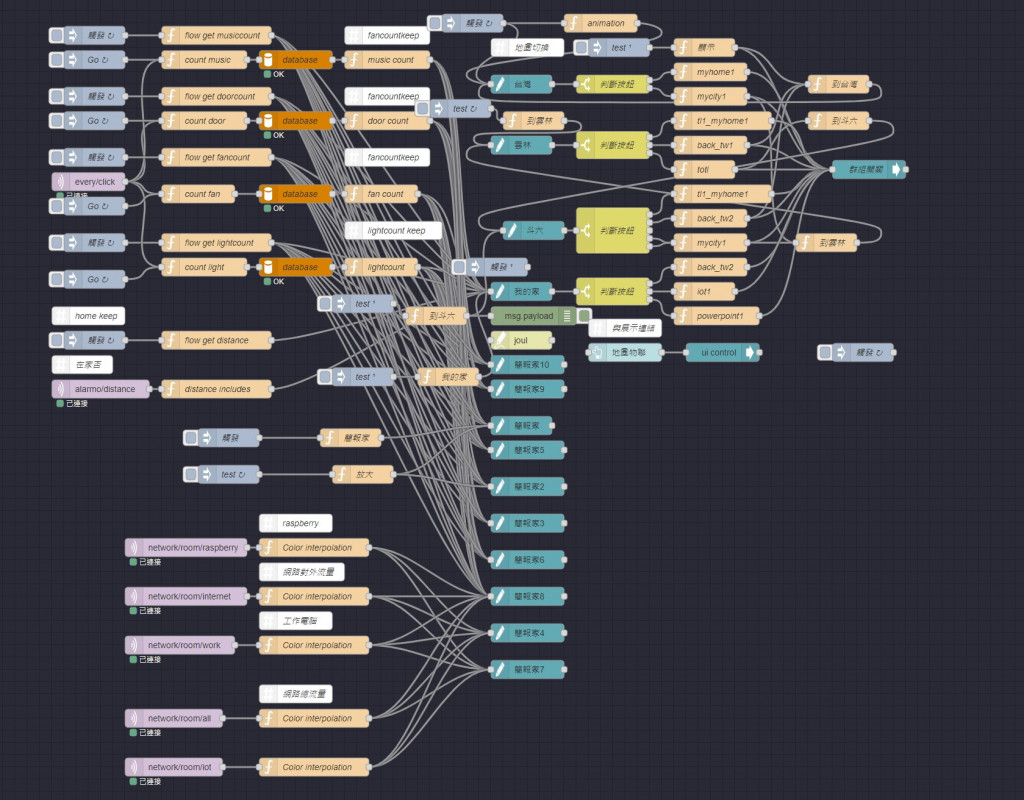
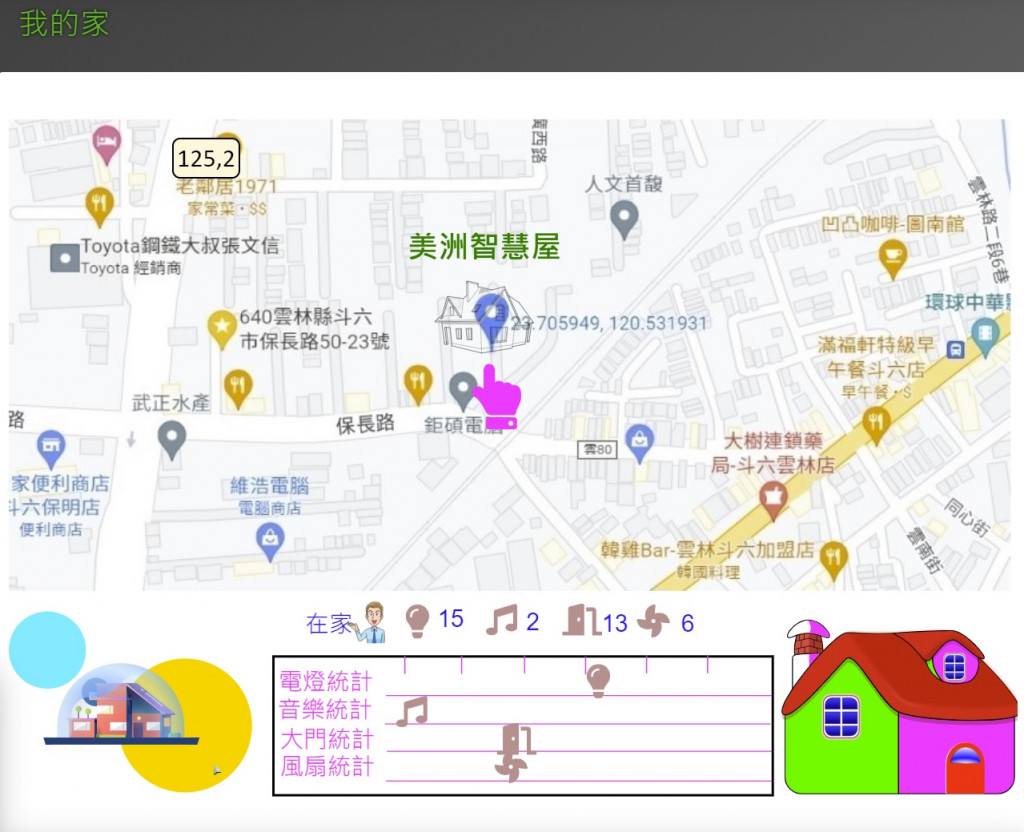
說明:以下各張圖取自3D建築物,利用Node Red mysql元件去連線資料庫,將值取至以下畫面
程式碼只有簡短如下,只取電燈其它語法相同:

msg.topic = "SELECT count(*) as lightcount FROM devicestatus where setting like '%燈' and mid(time,1,10) = curdate() order by time DESC;";
return msg;

https://ithelp.ithome.com.tw/upload/images/20220916/20136076UIsQhb8vv2.jpghttps://ithelp.ithome.com.tw/upload/images/20220916/20136076zt8727aI1Y.jpg
以下是結合家的電腦流量它會動態呈現,流量大的時候顏色會跟著變
https://ithelp.ithome.com.tw/upload/images/20220916/20136076kiloCtREWV.jpghttps://ithelp.ithome.com.tw/upload/images/20220916/2013607609YDkopq7p.jpg

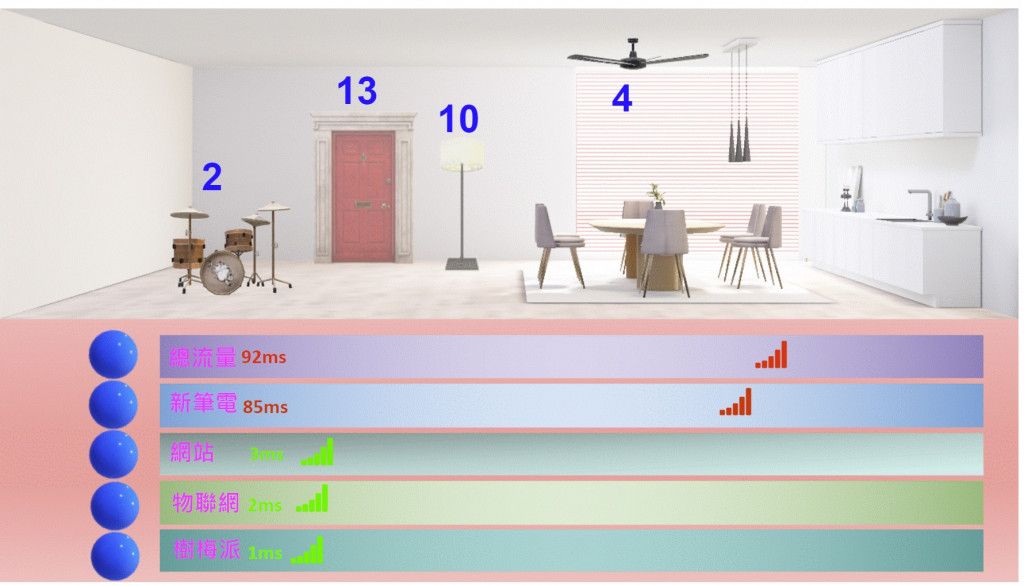
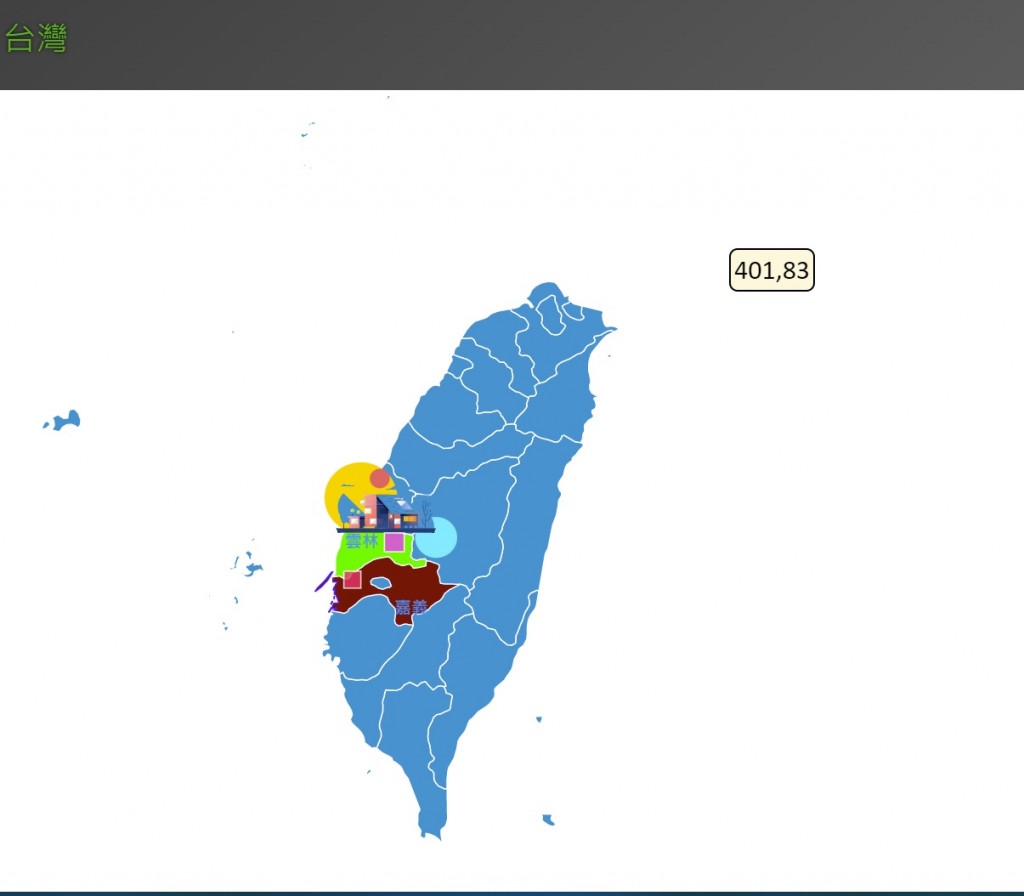
說明:以下是地圖,它可按了一個區域去做切換,例如當電燈按下後,地圖(貴單位可能各地區都有分公司)便立即統計數量(由MySql)
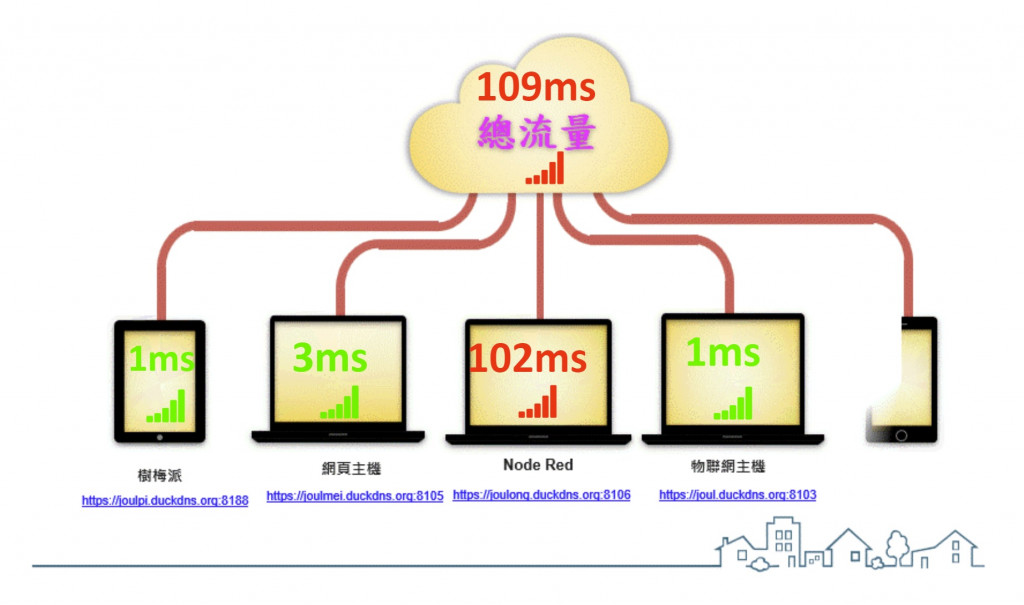
https://ithelp.ithome.com.tw/upload/images/20220916/20136076ZG5n1yagn5.jpghttps://ithelp.ithome.com.tw/upload/images/20220916/201360767pIfcrHf0B.jpghttps://ithelp.ithome.com.tw/upload/images/20220916/20136076nW8GeKYFSo.jpg

以下是 Node Red 畫面:
https://ithelp.ithome.com.tw/upload/images/20220916/20136076IFwcmzHhjc.jpg


上一篇
利用 Node Red 註冊存到 Google Excel及Mysql
下一篇
人臉辨識3
系列文
地圖物聯32
圖片
  直播研討會
圖片
{{ item.channelVendor }} {{ item.webinarstarted }} |
{{ formatDate(item.duration) }}
直播中

尚未有邦友留言

立即登入留言