今天要巡一下 Grafana 可以設定哪些東西?裡面又有哪些內容,今天就來帶各位看看!
上一篇設定好 Grafana VirtualService 還有 Prometheus 設定,今天就來跟大家一起看有哪些內容
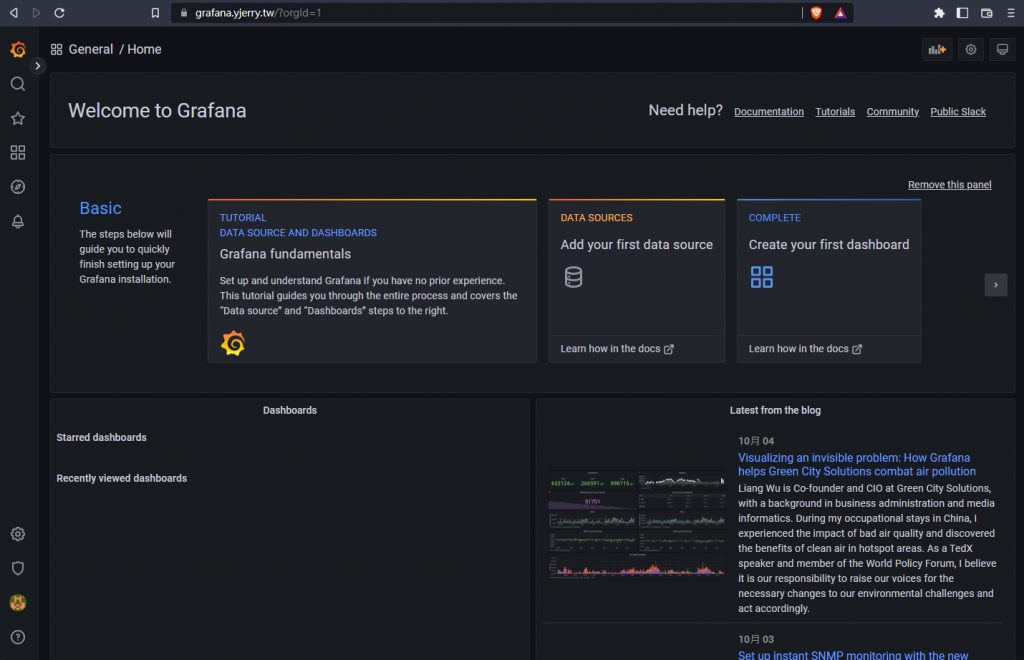
左側選單欄就可以看一些端睨
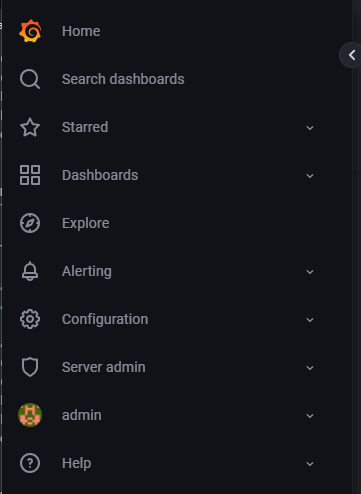
其中幾個選項需要講一講:
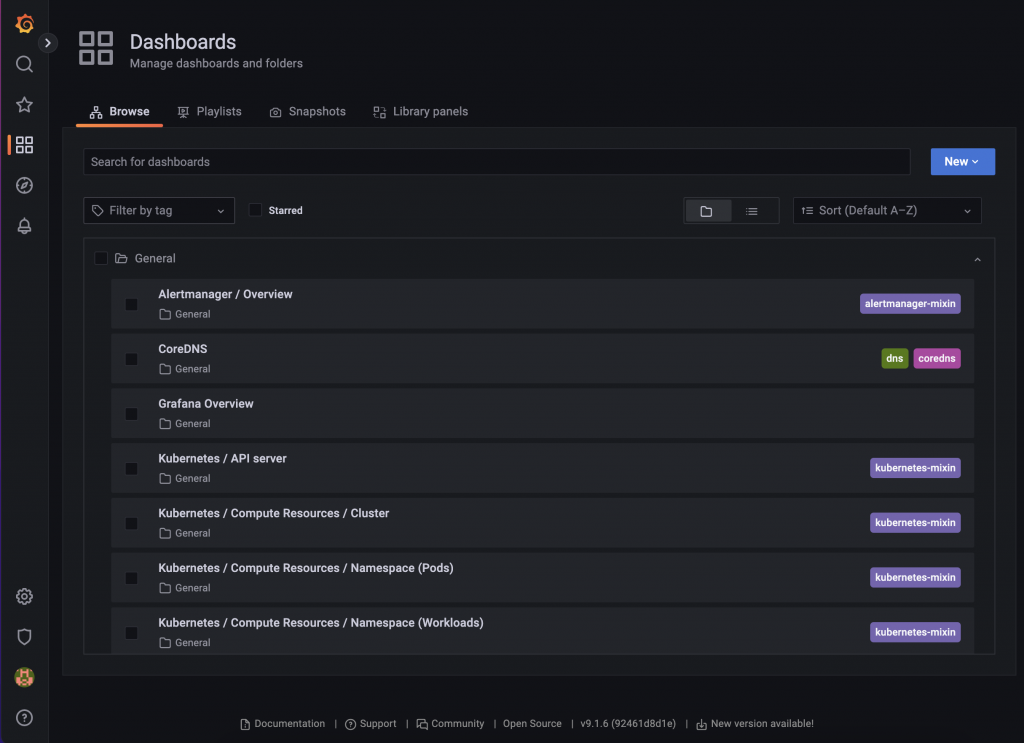
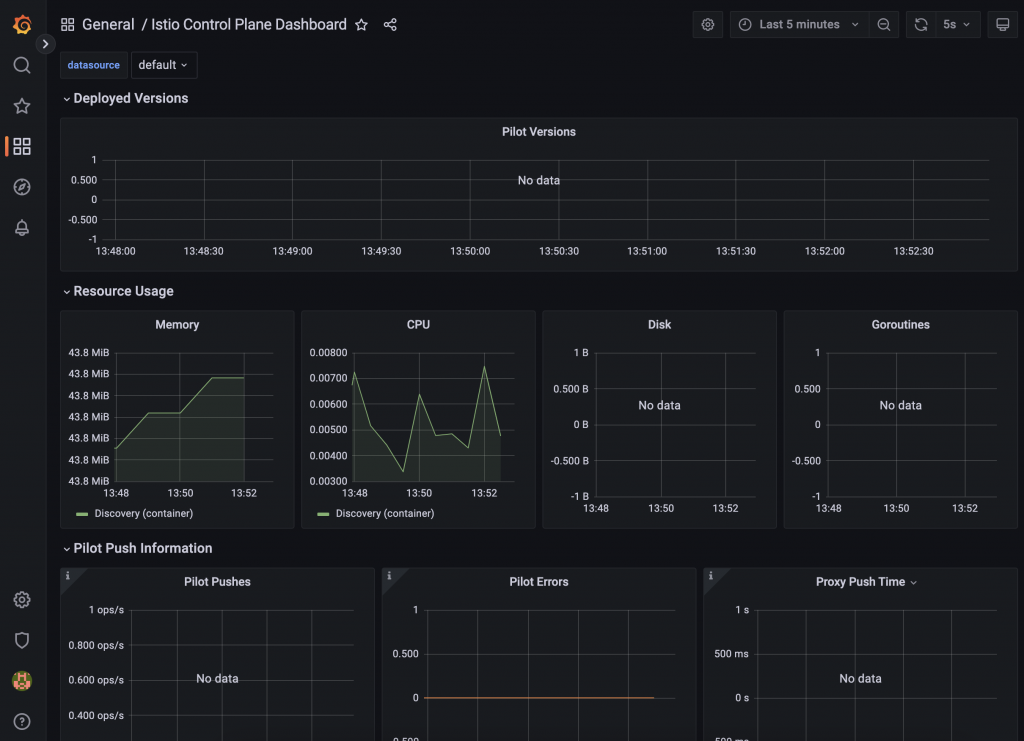
點進去到 Dashboards > Browse
點進去 Kubernetes / Compute Resources / Cluster 就會有 CPU
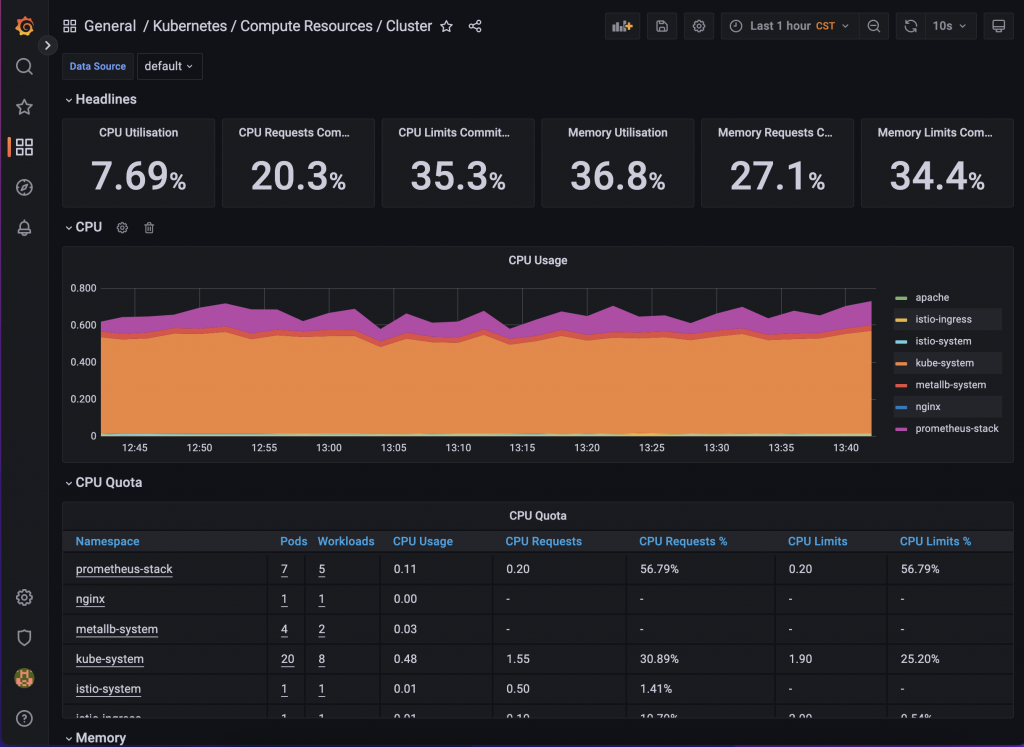
往下拉就會有 Memory 資料、網路、Storage 讀寫速度
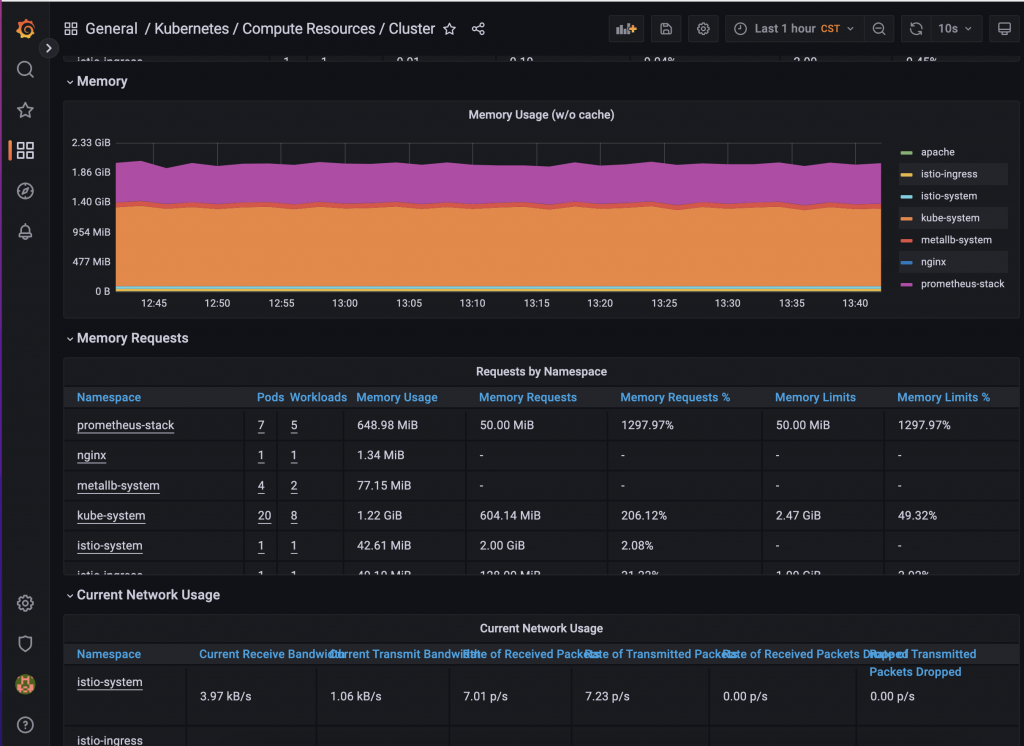
這些都是 kube-prometheus-stack 預先加入進去的圖表,就可以根據你的需求去做調整。
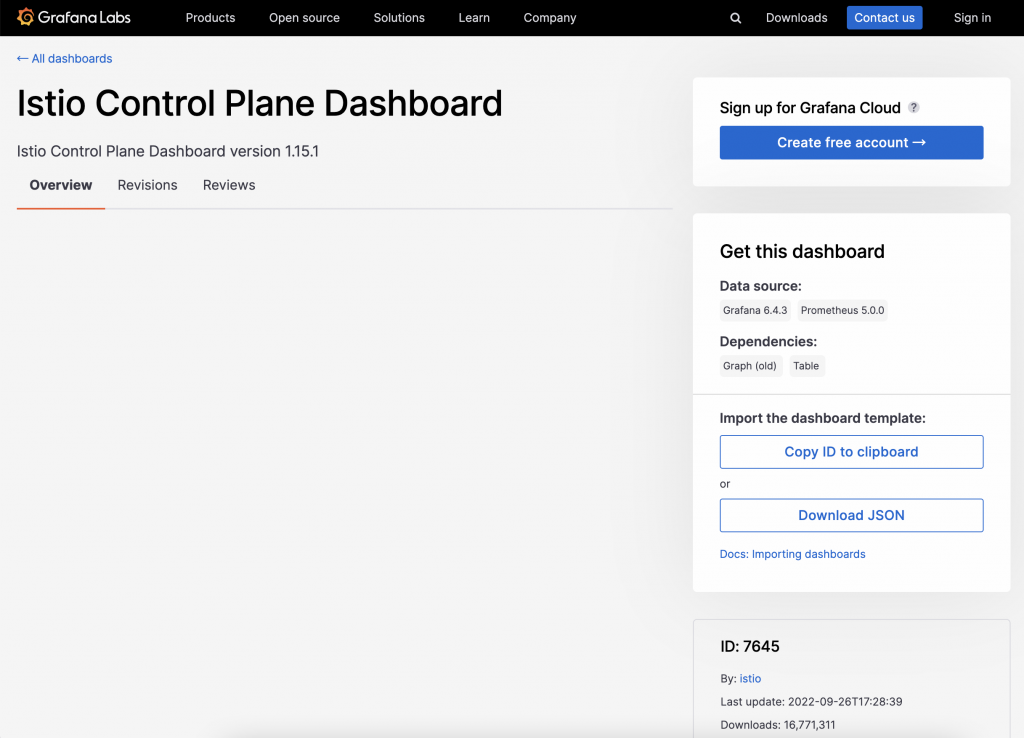
官方也開放讓大家投稿好用的 Dashboard,可以丟上去:https://grafana.com/grafana/dashboards/
看到不錯的圖表可以 Copy ID 到你的 Import 裡面
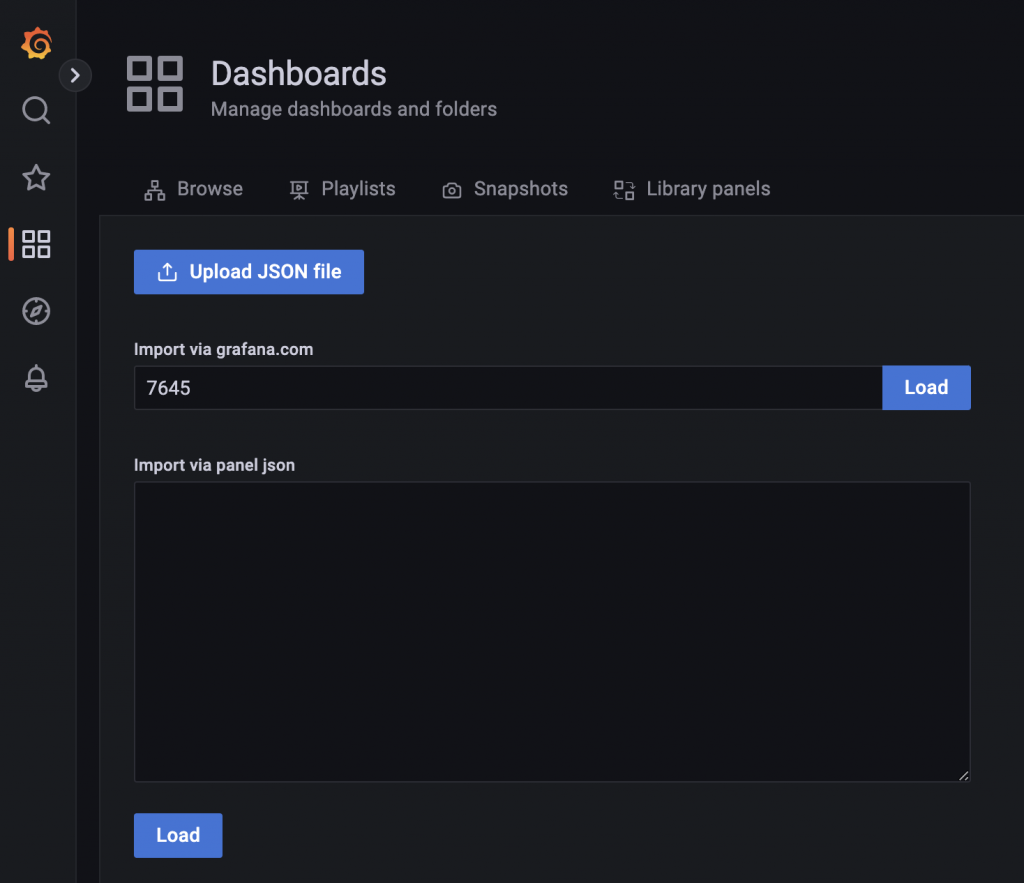
輸入 ID 進去或者 Import JSON 進去
選好要放在哪裡,採用哪個 Datasource,就可以按下 Import
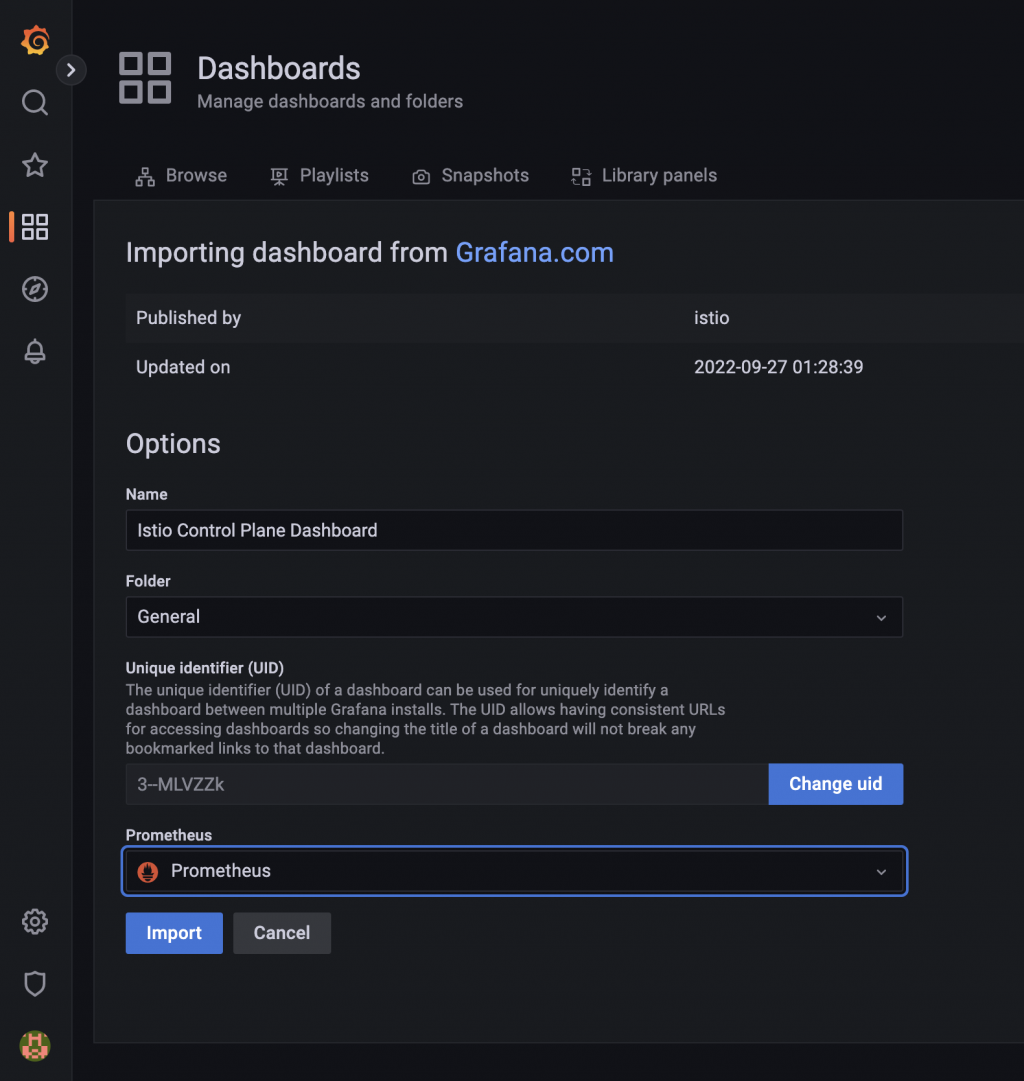
就可以看到新加入的 Dashboard 囉!
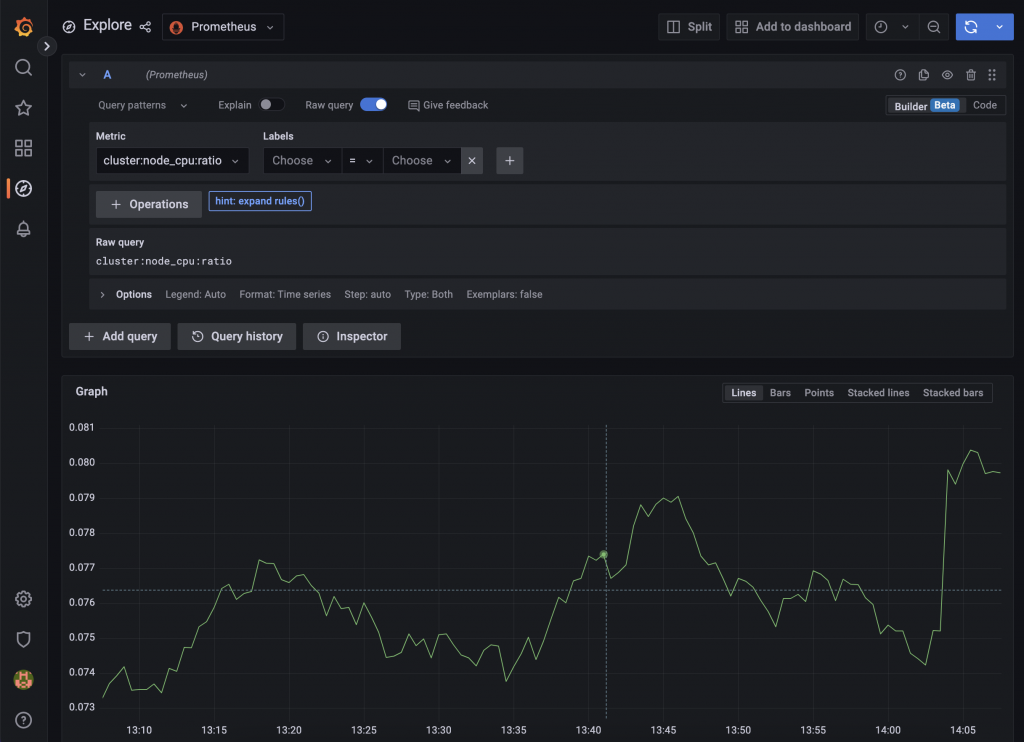
Explore 就是可以去測試 Grafana 傳給 PromQL 回傳的顯示資料
這裡的 Alerting 是 Grafana 自己的 Alerting,並非是 Prometheus 的 Alertmanager。
可以在 Alerting > Contact points 新增提醒的訊息,系統支援很多傳送,包含 LINE、Discord、Telegram、PagerDuty 等平台。
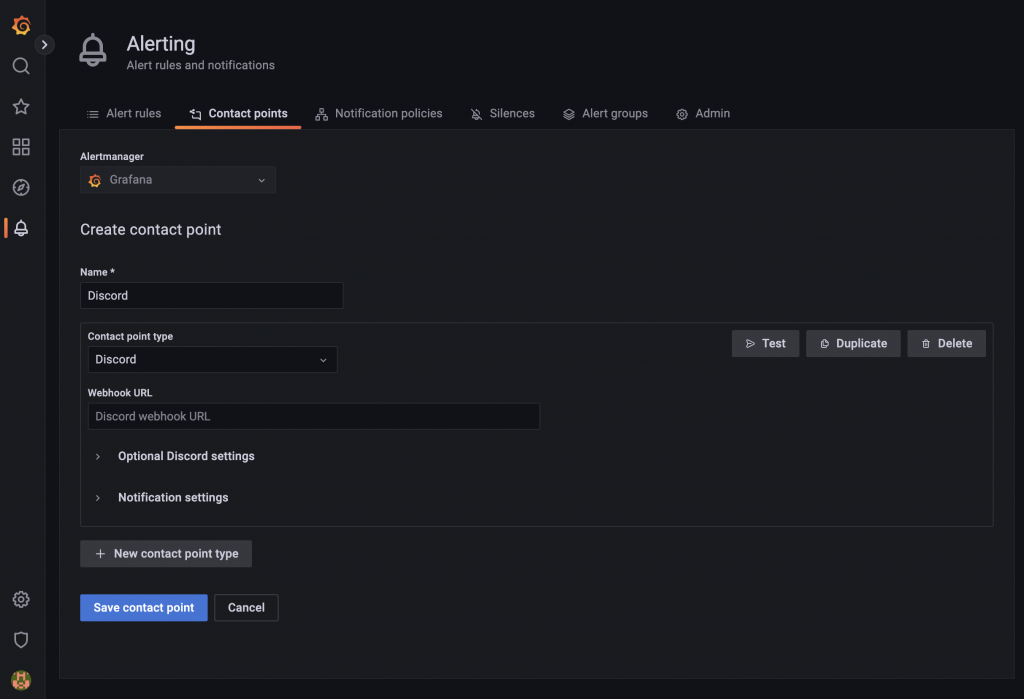
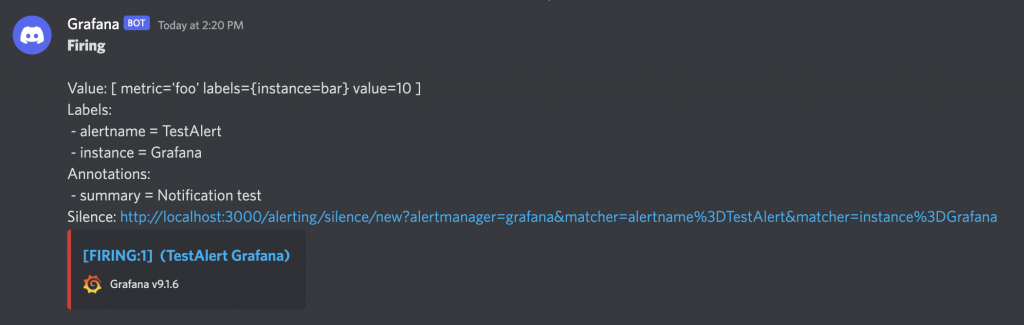
這個範例就可以直接傳送到 Discord Webhook
Configuration 可以新增資料來源,加入其他的 Prometheus Server,像是下一篇要介紹的 Logs Collection - Loki,往下拉也有關聯式資料庫 MySQL、PostgreSQL
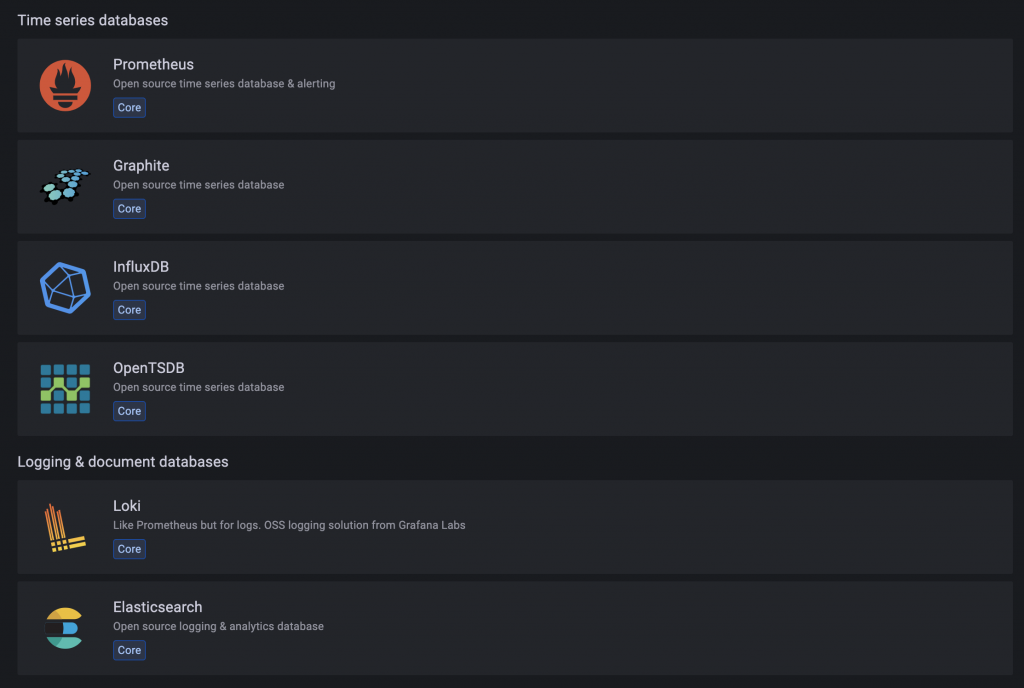
下一篇設定 Loki 的時候也會教怎麼加入資料來源。
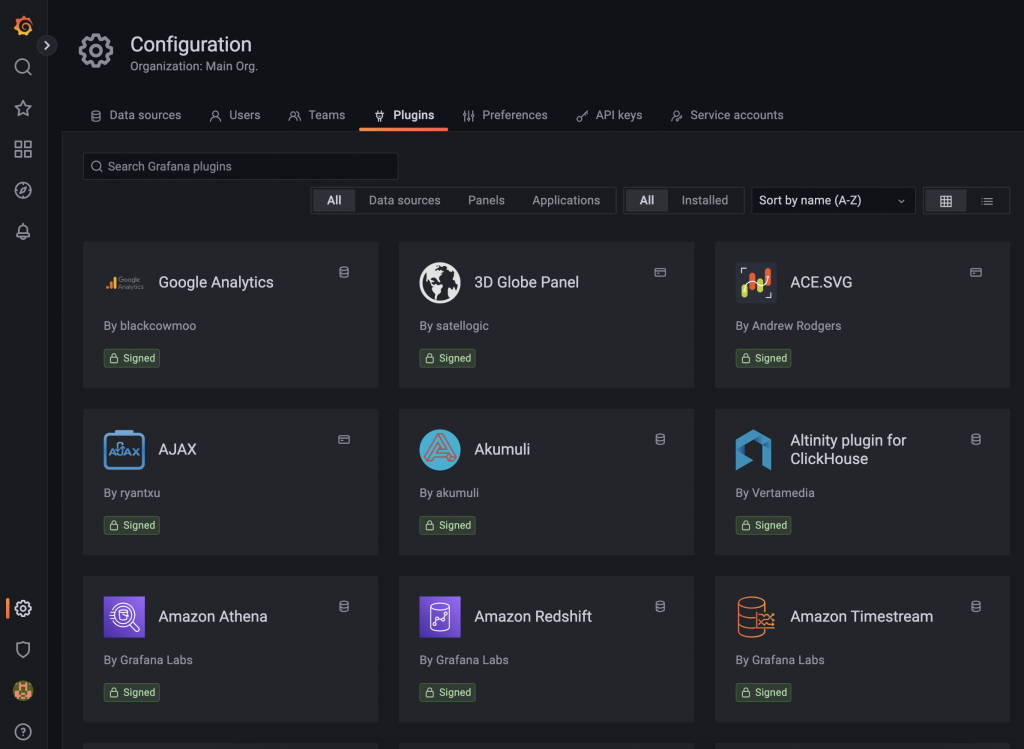
加入擴充套件還有 Service Account,Service Account 可以作為呼叫 Grafana Backend。
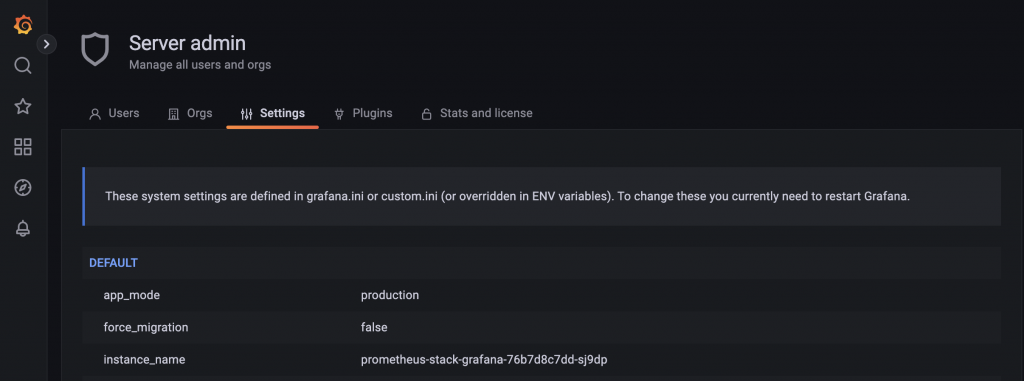
主要就是用來管理 Grafana Server 的地方啦,Users 跟 Orgs 可以在這裡做管理,還有系統的環境變數也會在這裡看到。
這裡簡單介紹的差不多了,剩下可以自己去探索摸出來,或者查詢文件學一下怎麼去更改 Dashboard。
監控其實還缺少一個東西,那就是每個 Container Log 資訊,可以轉到 Grafana 上面看到嗎?當然是可以的,我們會使用 Loki 來幫忙紀錄每個 Container 的 Log,下一篇就要來接上這裡。
本系列內容也會同步貼到我的 Blog https://blog.yangjerry.tw 歡迎來我的 Blog 點一下 RSS 追蹤,那我們就下一篇文章見啦!