當我們有了一些資料時,我們可以將這些資料視覺化,接下來會開始介紹matplotlib。
利用plt.plot()畫出長條圖
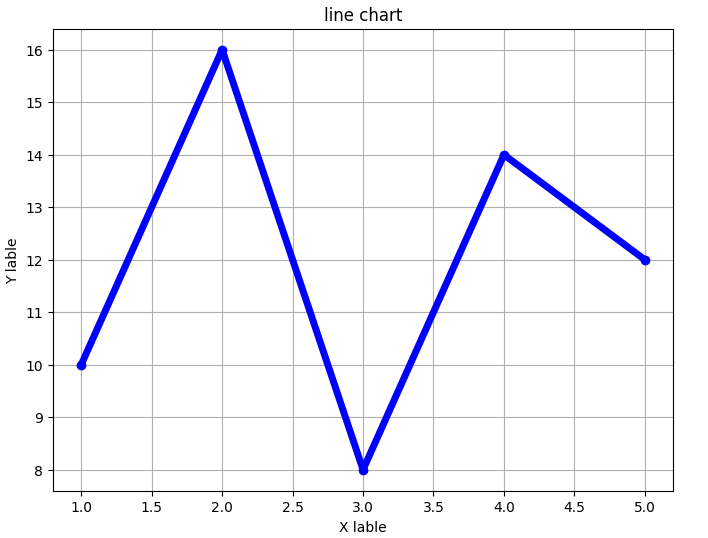
折線圖
import matplotlib.pyplot as plt  #載入matplotlib裡的pyplot繪圖套件

x = [1, 2, 3, 4, 5]  # x軸的數值
y = [10, 16, 8, 14, 12]  # y軸的數值

plt.figure(figsize=(8, 6))  # 設定圖表的大小

# 設定折線的樣式、顏色和標籤及調整粗細
plt.plot(x, y,  color='b',marker='o', linestyle='-', label='折線圖',linewidth=5)
#也可寫成plt.plot(x, y, 'bo-',linewidht=5)

# 添加標題和軸標籤
plt.title('line chart') #標題
plt.xlabel('X lable')   #x軸名稱
plt.ylabel('Y lable')   #y軸名稱

# 顯示圖表
plt.grid(True)  # 顯示網格
plt.show().

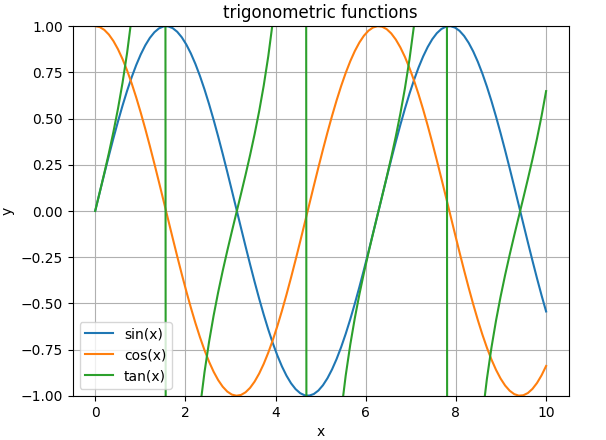
接下來搭配numpy,並在一張圖中畫出多個三角函數
import numpy as np
import matplotlib.pyplot as plt

x = np.linspace(0, 10, 100)   # 產生 0~10 間連續 100 個數字
y1 = np.sin(x)                # 每個數字對應的 sin 值
y2 = np.cos(x)                # 每個數字對應的 cos 值
y3 = np.tan(x)                # 每個數字對應的 tan 值

plt.plot(x, y1, label='sin(x)')  # 畫出第一條線段
plt.plot(x, y2, label='cos(x)')  # 畫出第二條線段
plt.plot(x, y3, label='tan(x)')  # 畫出第三條線段

plt.ylim(-1, 1)  # 設定y軸範圍在-1到1之間
plt.legend()  # 添加圖例
plt.title('trigonometric functions')
plt.xlabel('x')
plt.ylabel('y')
plt.grid(True)

plt.show()

折線圖的部分就先學到這咯!
---20230923---
