2023 iThome 鐵人賽
分享至
今天繼續來做示範圖表吧!
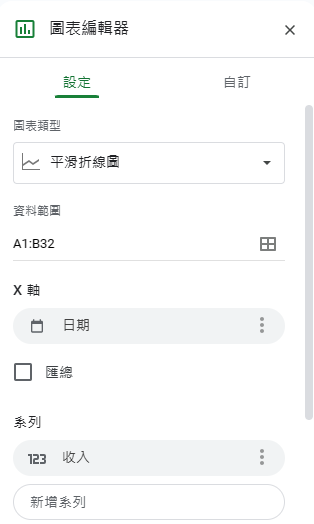
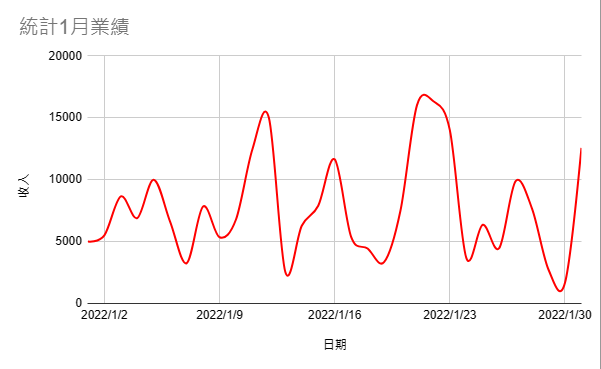
折線圖:統計1月業績1.插入圖表2.選擇折線圖3.輸入資料範圍4.輸入標籤5.輸入值6.輸入圖表標題
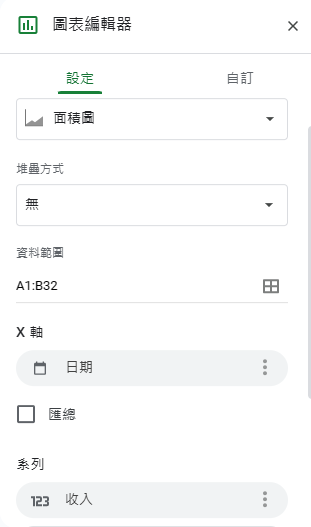
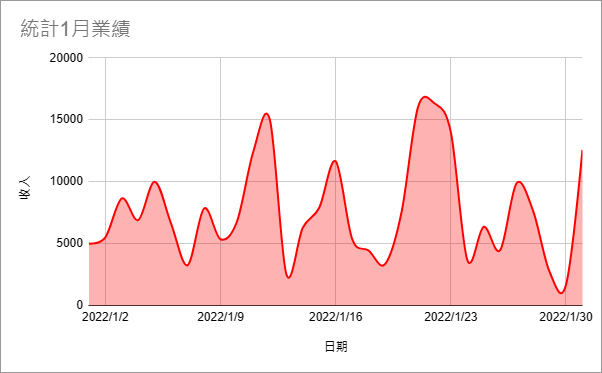
面積圖:統計1月業績1.插入圖表2.選擇折線圖3.輸入資料範圍4.輸入標籤5.輸入值6.輸入圖表標題
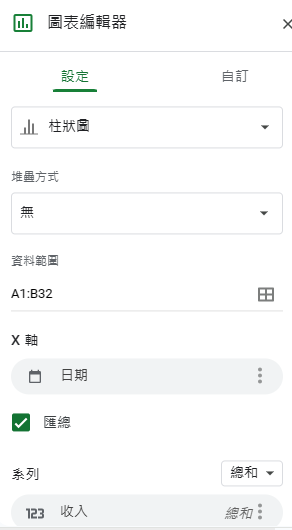
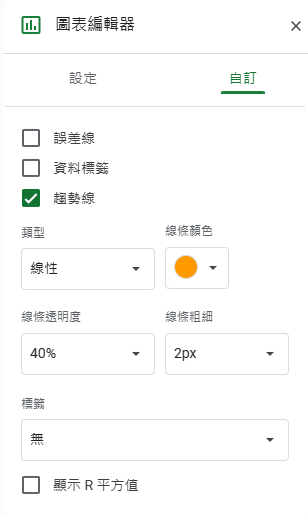
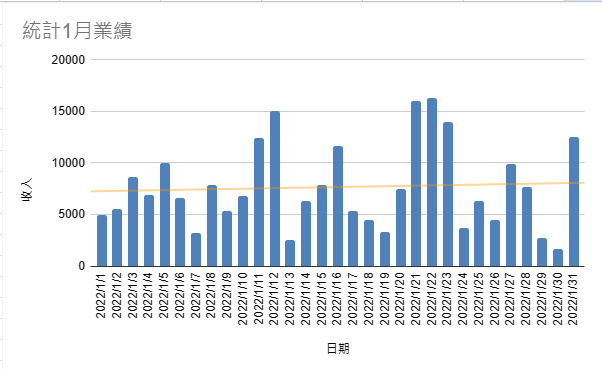
長條圖:統計1月業績1.插入圖表2.選擇折線圖3.輸入資料範圍4.輸入標籤5.輸入值6.添加趨勢線7.輸入圖表標題
差不多就示範到這邊,其實作法都差不多啦(心虛),我們明天見!
IT邦幫忙


 iThome鐵人賽