在本節中,我們將深入學習監督式機器學習的兩大主要分支:回歸模型和分類模型。首先,我們將應用線性回歸和決策樹等模型來預測股價,並使用均方誤差(MSE)等指標評估模型性能。接著,我們將使用邏輯回歸、支持向量機(SVM)等模型預測價格走勢方向,並通過準確率、混淆矩陣等指標評估分類模型的效果。今日 Colab
監督式學習是一種機器學習方法,利用帶有標籤的數據進行模型訓練,以預測未知數據的結果。根據預測目標的不同,監督式學習可分為:

線性回歸試圖找到自變量 X 與因變量 Y 之間的線性關係,模型形式為:

其中,\beta 是模型參數,\epsilon 是誤差項。
import pandas as pd
import numpy as np
import yfinance as yf
from sklearn.linear_model import LinearRegression
from sklearn.metrics import mean_squared_error

# 獲取數據
data = yf.download('AAPL', start='2015-01-01', end='2021-01-01')

# 特徵工程
data['Returns'] = data['Adj Close'].pct_change()
data['SMA'] = data['Adj Close'].rolling(window=20).mean()
data['Volatility'] = data['Returns'].rolling(window=20).std()
data.dropna(inplace=True)

# 構建特徵和標籤
X = data[['SMA', 'Volatility']]
y = data['Adj Close']

# 分割訓練集和測試集
X_train = X[X.index < '2020-01-01']
X_test = X[X.index >= '2020-01-01']
y_train = y[y.index < '2020-01-01']
y_test = y[y.index >= '2020-01-01']

# 標準化
from sklearn.preprocessing import StandardScaler
scaler = StandardScaler()
X_train_scaled = scaler.fit_transform(X_train)
X_test_scaled = scaler.transform(X_test)

# 建立模型
model = LinearRegression()
model.fit(X_train_scaled, y_train)

# 預測
y_pred = model.predict(X_test_scaled)

# 評估模型
mse = mean_squared_error(y_test, y_pred)
print()
print(f'均方誤差(MSE):{mse:.2f}')

import matplotlib.pyplot as plt

plt.figure(figsize=(12,6))
plt.plot(y_test.index, y_test.values, label='實際股價', color='blue')
plt.plot(y_test.index, y_pred, label='預測股價', color='red', linestyle='--')
plt.title('實際股價 vs. 預測股價(線性回歸)')
plt.xlabel('日期')
plt.ylabel('股價')
plt.legend()
plt.savefig("regression_predict.png")
可以看到下圖,感覺趨勢抓得還不錯: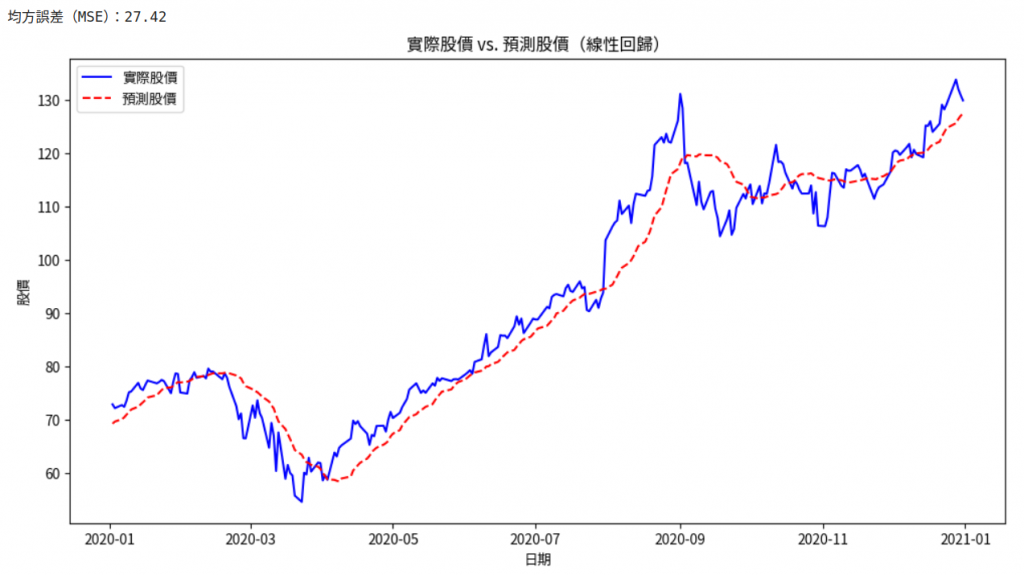
均方誤差(MSE):

反映了預測值與實際值之間的平均平方差,值越小,模型性能越好。
決定係數(( R^2 )):

反映了模型解釋變異的能力,值越接近1,模型越好。
from sklearn.metrics import r2_score
r2 = r2_score(y_test, y_pred)
print(f'決定係數(R^2):{r2:.2f}')
可得: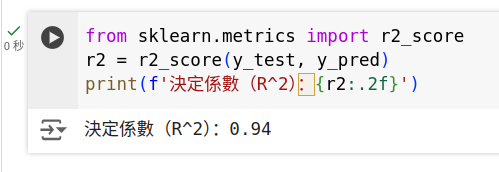
決策樹回歸使用樹狀結構將數據分割為多個區間,在每個區間內使用平均值進行預測。
from sklearn.tree import DecisionTreeRegressor

# 建立模型
model = DecisionTreeRegressor(max_depth=5)
model.fit(X_train_scaled, y_train)

# 預測
y_pred = model.predict(X_test_scaled)

# 評估模型
mse = mean_squared_error(y_test, y_pred)
print(f'均方誤差(MSE):{mse:.2f}')

plt.figure(figsize=(12,6))
plt.plot(y_test.index, y_test.values, label='實際股價', color='blue')
plt.plot(y_test.index, y_pred_tree, label='預測股價', color='green', linestyle='--')
plt.title('實際股價 vs. 預測股價(決策樹回歸)')
plt.xlabel('日期')
plt.ylabel('股價')
plt.legend()
plt.show()
可得下面,感覺目前的方法+參數相較於剛剛的簡單回歸弱好多: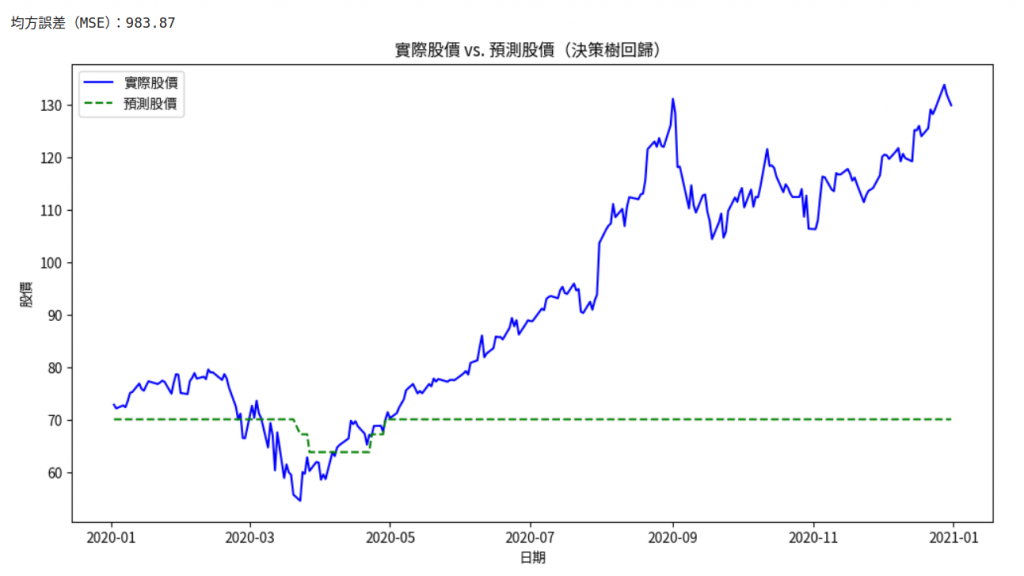
有興趣的朋友可以下考慮以下方式來優化看看可不可拿得夠好的結果:
max_depth):防止過擬合。邏輯回歸用於處理二分類問題,模型形式為:

from sklearn.linear_model import LogisticRegression
from sklearn.metrics import accuracy_score, confusion_matrix, classification_report

# 構建標籤
data['Target'] = np.where(data['Returns'] > 0, 1, 0)

# 更新特徵和標籤
y = data['Target']
X_train = X_train_scaled
X_test = X_test_scaled
y_train = y[y.index < '2020-01-01']
y_test = y[y.index >= '2020-01-01']

# 建立模型
model = LogisticRegression()
model.fit(X_train, y_train)

# 預測
y_pred = model.predict(X_test)

# 評估模型
accuracy = accuracy_score(y_test, y_pred)
print(f'準確率:{accuracy:.2%}')

# 混淆矩陣
cm = confusion_matrix(y_test, y_pred)
print('混淆矩陣:\n', cm)

# 分類報告
report = classification_report(y_test, y_pred)
print('分類報告:\n', report)
可得: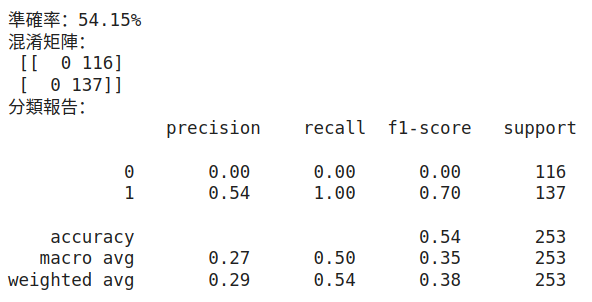
SVM試圖找到一個最佳的超平面,將數據劃分為不同的類別,這裡我們不展開數學,並最大化分類間隔,有興趣的朋友可以去這裡了解細節。
from sklearn.svm import SVC

# 建立模型
model = SVC(kernel='rbf', C=1.0, gamma='scale')
model.fit(X_train, y_train)

# 預測
y_pred = model.predict(X_test)

# 評估模型
accuracy = accuracy_score(y_test, y_pred)
print(f'準確率:{accuracy:.2%}')
C、gamma、kernel等。
| 實際正類 | 實際負類 | |
|---|---|---|
| 預測正類 | 真正類 (TP) | 假正類 (FP) |
| 預測負類 | 假負類 (FN) | 真負類 (TN) |
精確率(Precision):

召回率(Recall):

F1-score:

MSE、R^2**等指標用於比較不同回歸模型的性能。解決方法:
將前面的代碼整合,對不同的模型進行訓練和評估。
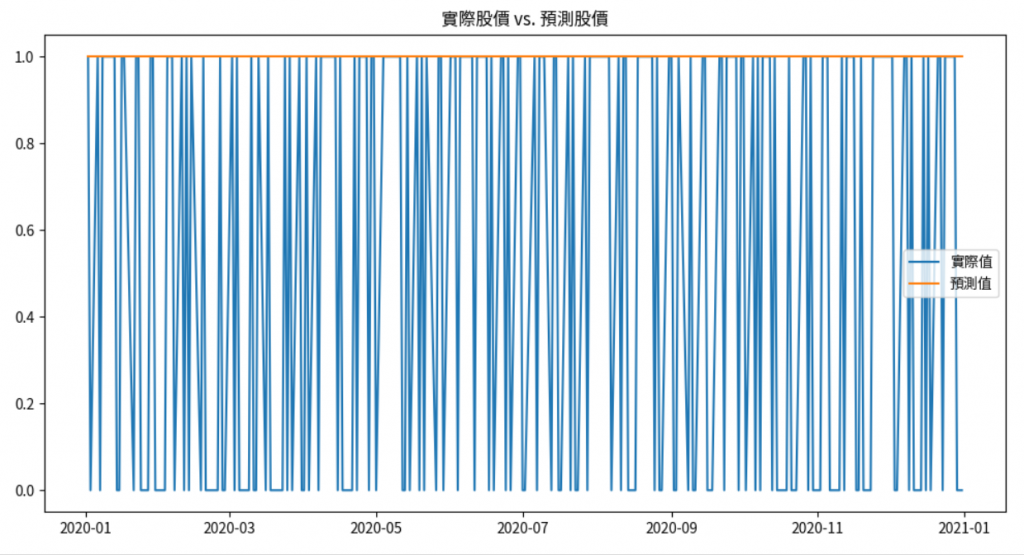
import matplotlib.pyplot as plt

# 回歸結果可視化
plt.figure(figsize=(12,6))
plt.plot(y_test.index, y_test.values, label='實際值')
plt.plot(y_test.index, y_pred, label='預測值')
plt.title('實際股價 vs. 預測股價')
plt.legend()
plt.show()

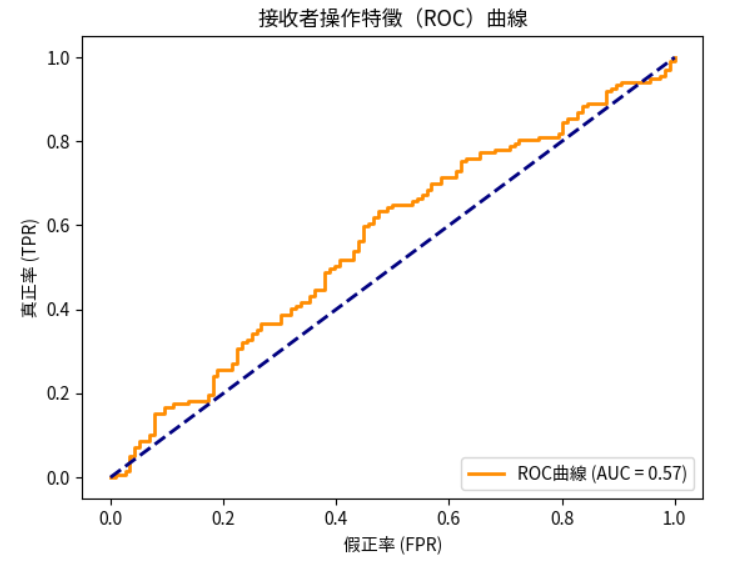
# 分類結果可視化
from sklearn.metrics import roc_curve, auc

# 計算ROC曲線
y_score = model.decision_function(X_test)
fpr, tpr, thresholds = roc_curve(y_test, y_score)
roc_auc = auc(fpr, tpr)

# 繪製ROC曲線
plt.figure()
plt.plot(fpr, tpr, color='darkorange', lw=2, label=f'ROC曲線 (AUC = {roc_auc:.2f})')
plt.plot([0, 1], [0, 1], color='navy', lw=2, linestyle='--')
plt.xlabel('假正率 (FPR)')
plt.ylabel('真正率 (TPR)')
plt.title('接收者操作特徵(ROC)曲線')
plt.legend(loc='lower right')
plt.show()
在本節中,我們:
在接下來的學習中,我們將進一步探討模型優化和交叉驗證等技術,以提高模型的泛化能力和性能。
作業:
透過實踐,您將更深入地理解監督式學習模型在金融領域的應用,並掌握模型構建和評估的技巧。
提示:
交叉驗證:使用cross_val_score等方法對模型進行交叉驗證,評估模型的穩定性。
from sklearn.model_selection import cross_val_score
scores = cross_val_score(model, X_train, y_train, cv=5, scoring='neg_mean_squared_error')
print('交叉驗證MSE:', -scores)
網格搜索:使用GridSearchCV自動調整模型的超參數。
from sklearn.model_selection import GridSearchCV
param_grid = {'C': [0.1, 1, 10], 'gamma': ['scale', 'auto']}
grid = GridSearchCV(SVC(), param_grid, cv=5)
grid.fit(X_train, y_train)
print('最佳參數:', grid.best_params_)
特徵重要性:對於決策樹和隨機森林等模型,可以查看特徵的重要性。
model = RandomForestClassifier()
model.fit(X_train, y_train)
importance = model.feature_importances_
feature_importance = pd.Series(importance, index=X.columns)
print('特徵重要性:\n', feature_importance)
注意:
