今天來體驗 Prometheus ,是一個監控系統加排序資料庫(Time-series DB),主要用於監控主機跟服務的性能。
# 預期的資料結構
C:\USERS\ASUS\STEVEN\PROMETHEUS
│  docker-compose.yml
│
└─prometheus
        prometheus.yml
docker-compose.yml
version: "3.9"

services:
  prometheus:
    image: prom/prometheus:latest
    container_name: prometheus
    ports:
      - "9090:9090"          # Prometheus UI
    volumes:
      - ./prometheus/prometheus.yml:/etc/prometheus/prometheus.yml:ro
    command: ["--config.file=/etc/prometheus/prometheus.yml"]

  example-app:
    image: quay.io/brancz/prometheus-example-app:v0.3.0
    container_name: prom-example
    ports:
      - "8080:8080"          # 範例應用的 /metrics
    environment:
      - HTTP_LISTEN_ADDRESS=:8080
      # 這個 app 會自動在 /metrics 暴露 counter/gauge/histogram

  grafana:
    image: grafana/grafana:latest
    container_name: grafana
    ports:
      - "3000:3000"          # Grafana UI (帳密 admin/admin)
    environment:
      - GF_SECURITY_ADMIN_USER=admin
      - GF_SECURITY_ADMIN_PASSWORD=admin
    volumes:
      - grafana-data:/var/lib/grafana

volumes:
  grafana-data:
global:
  scrape_interval: 5s
  evaluation_interval: 15s

scrape_configs:
  - job_name: "example-app"
    static_configs:
      - targets: ["example-app:8080"]   # 由 compose DNS 解析到容器
docker-compose up -d
docker-compose 順利執行後,grafana-ui 直接按這個就能打開網站了進到了 grafana 裡面後,我們就來監控一下剛剛docker-compose中有順帶起的一個prometheus的範例容器,好幫助我們來熟悉如何去監控我們的應用
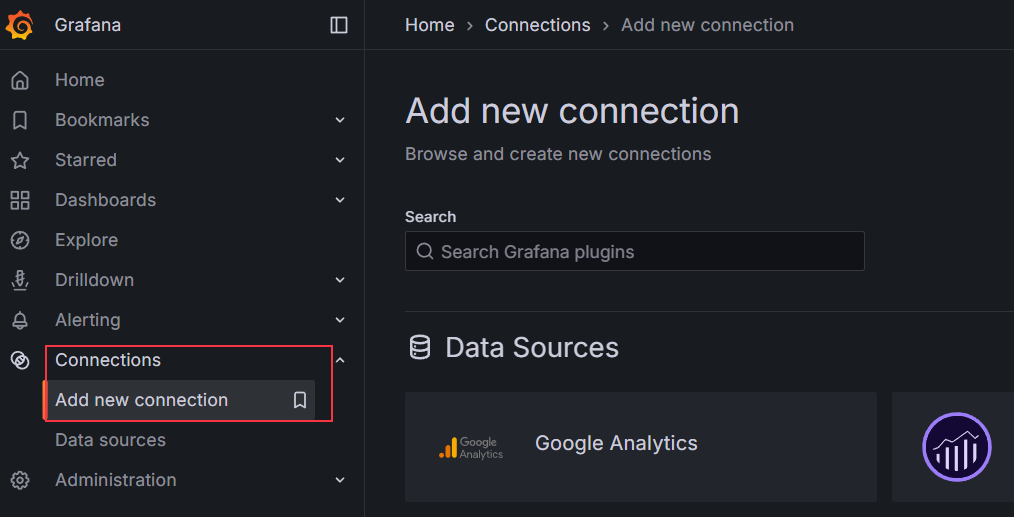
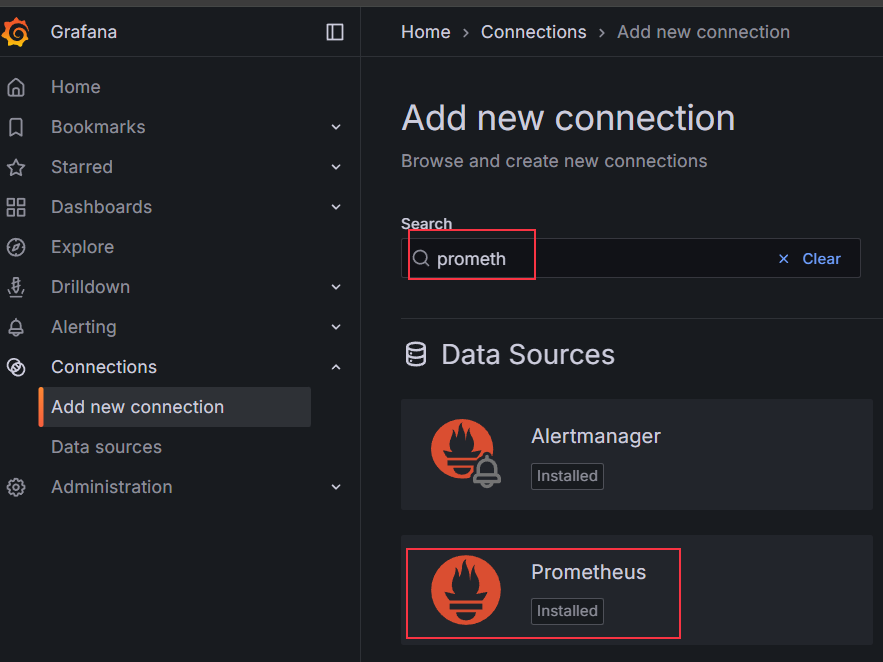
Connections,再選擇Add new connection
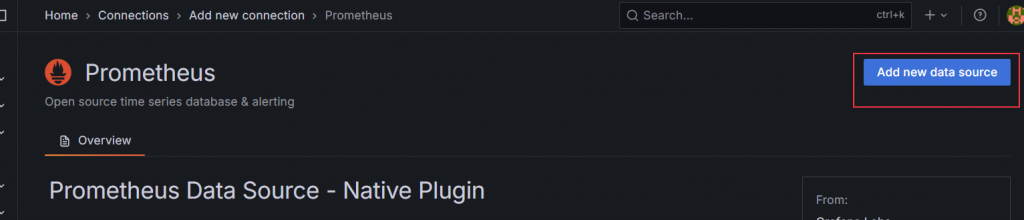
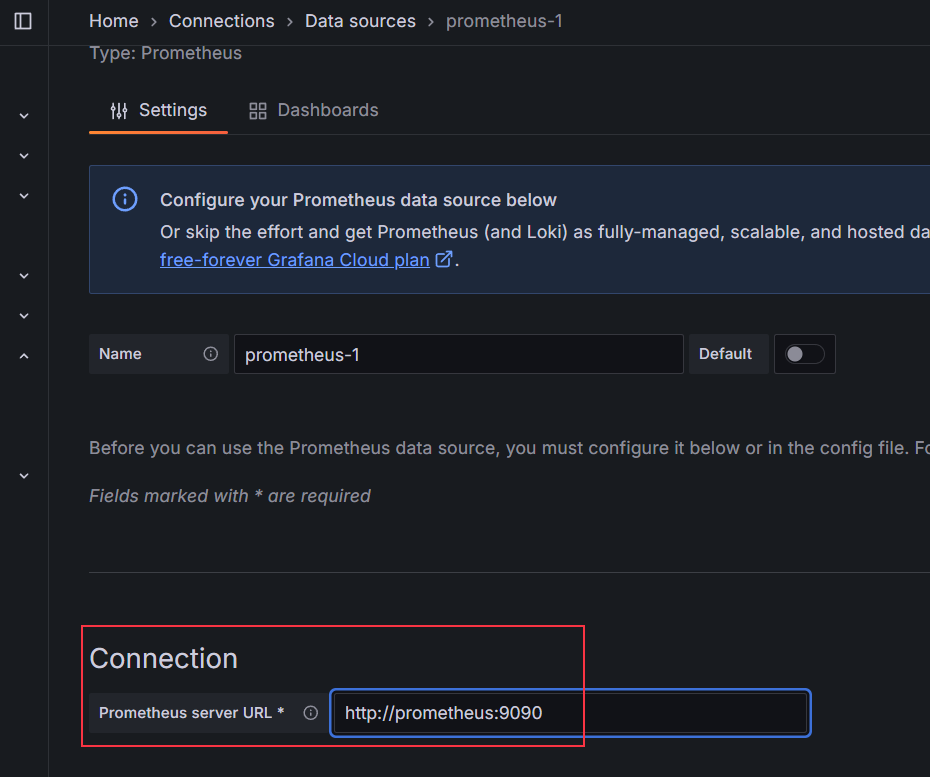
Add new data source
Save & Test
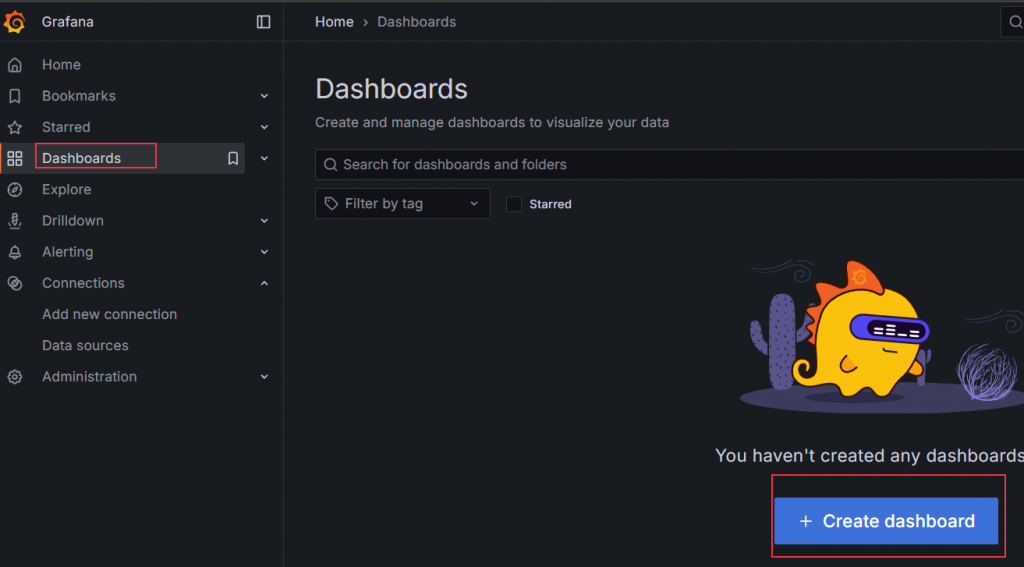
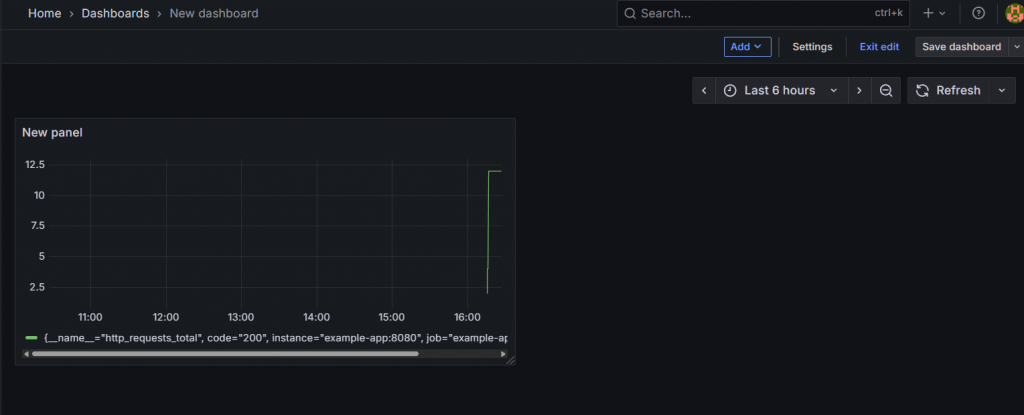
Dashboards,再選擇Create dashboard
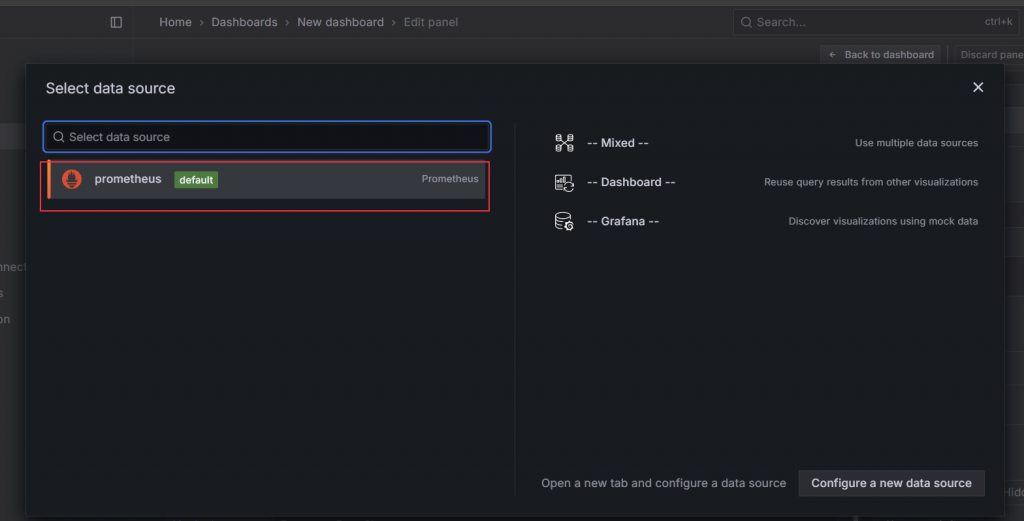
Add visualization,data source選擇prometheus,第3步存的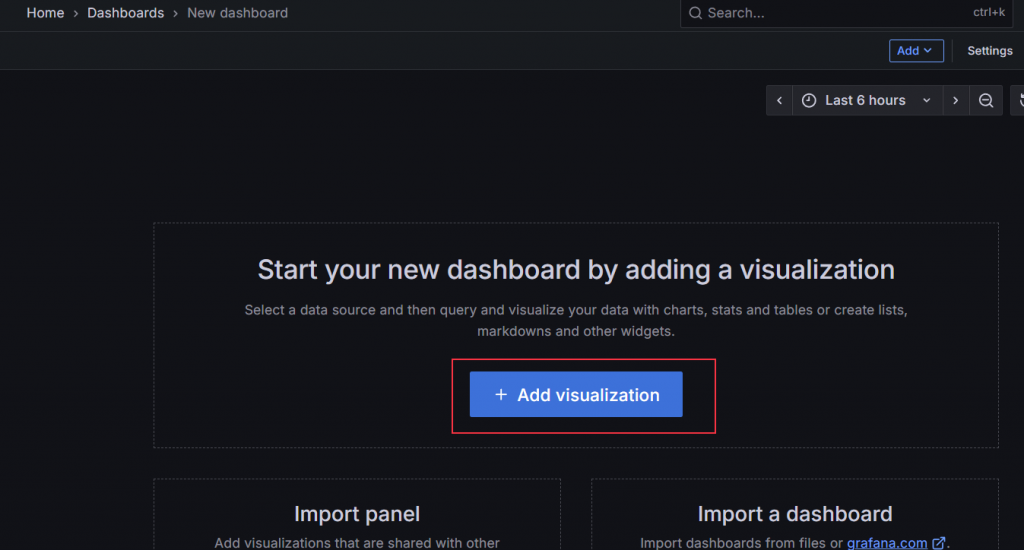
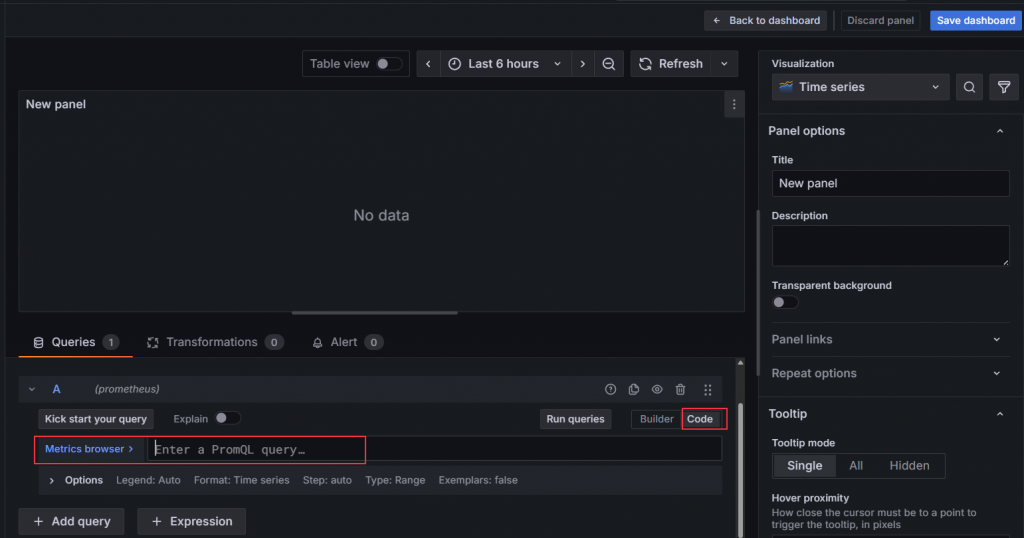
Code的地方,輸入http_requests_total,按Save dashboard,再按Back to dashboard
今天先簡單體驗一下prometheus到一個範例監控的小場景,明天來搭配之前的C++ grpc server做相關的監控。