
Ep15 先把 Master、Worker、Driver、Executor 放回同一張 cluster 地圖;Ep16 再從 spark-submit 出發,看 Driver 如何把 task 交給 Executors。這一集沿著同一個 application,改追蹤 task 真正處理的資料:Parquet input、shuffle 的中間資料,以及 cache() 後的資料,究竟各自留在哪裡?
這個問題會直接影響我們讀 Spark UI 時的判斷。看到 Input、Shuffle Read、Storage memory 或磁碟用量時,我希望能知道它們對應的資料是什麼、由誰保存,以及下一個 action 是否真的重用了前一次的結果。
repartition(8, "key") 如何讓兩個 Executors 寫出並 fetch shuffle blocks。Ep15:誰提供資源?
Master、Worker、Driver、Executor 分別在哪裡
↓
Ep16:task 如何被交出去?
Driver 將 stage 中的 tasks 排到 Executors
↓
Ep17:task 處理的資料在哪裡?
input、shuffle、cache 的位置與重用方式
這一集不討論記憶體不足、spill、Worker 故障或 dynamic allocation。實驗刻意維持小資料與固定的兩個 Executors,讓資料位置和 UI 指標可以一一對照。
這次的資料旅程如下:
共享 Parquet input
    ↓ Executor scan tasks 讀取
repartition(8, "key")
    ↓ 每個 Executor 寫出 shuffle blocks
Worker local disk
    ↓ 下游 tasks 依 key 取得需要的 blocks
cache() + count()
    ↓ 將完成的 partitions 保留在 Block Manager
Executor memory
    ↓ 下一個 action 讀取 cached blocks
新的計算結果
三個位置要分開看:
| 資料種類 | 這次實驗中的位置 | 生命週期 |
|---|---|---|
| Parquet input | 兩個 Worker 都能讀取的 /opt/ep17-shared/input-events |
原始資料仍留在共享 storage,讀取不會搬到 Master。 |
| shuffle intermediate files | 產生它的 Executor 所在 Worker 的 local disk | 供 downstream stage 取得,Executor 或 application 結束後可被清理。 |
| cached partitions | Executor 的 Block Manager;本次全部放進 memory | 留到 unpersist()、memory 壓力、Executor 結束或 application 結束。它們是 cache 點 output partitions 的實體 blocks。 |
Master 仍然負責資源協調,沒有承接這些資料的集中儲存工作。Driver 則規劃 stages、知道 cache 是否可用,並向 Executors 排程 tasks。
block:Spark 能保存、定位與傳輸的一包資料這篇會多次提到 block。它可以先理解成 Spark 替一段可存取資料加上的包裝與地址:Block Manager 知道它的 ID、在哪個 Executor、目前在 memory 或 disk,並能讓其他 task 取得它。
partition 和 block 描述的是不同角度:
partition:邏輯上的資料切片,也是 task 的工作單位
block:某段資料實際被保存或傳輸時,Block Manager 可定位的單位
兩者常常是一對一,所以很容易混用。這次 cache() 後有 8 個 partitions,也在 Storage tab 看見 8 個 cached blocks;每個 cache block 保存一個 partition 的資料。shuffle 的情況不同:上游 task 會產生交給多個下游 partition 的 shuffle blocks,下游 task 再從各個 Executor 取得自己需要的部分。
Spark block 沒有固定的 row 數或 byte 大小,也不要把它和 Parquet page、Parquet row group、作業系統 disk block 混在一起。它是 Spark 執行期用來管理 cached data、shuffle data、broadcast data 等內容的資料單位。
讀取、shuffle 與 cache 對應三種不同位置:共享 input、Worker local disk、Executor Block Manager。把它們分開,Spark UI 的 I/O 指標才有明確意義。
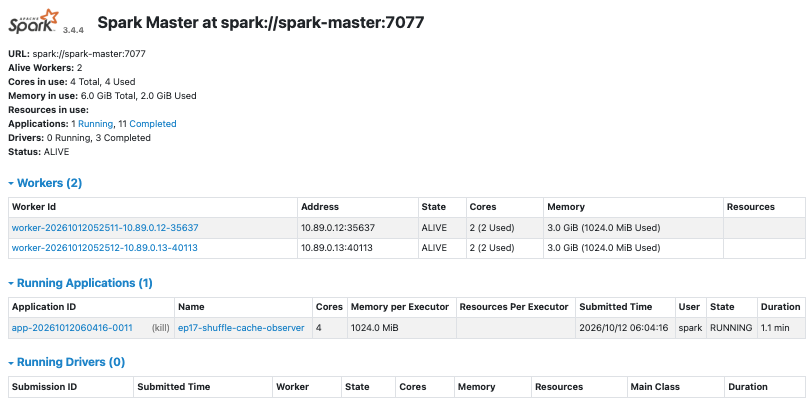
這次沿用兩個 Worker 的 Standalone cluster。每個 Worker 提供 2 cores、3 GiB memory;application 申請兩個 Executors,每個 Executor 使用 2 cores、1024 MiB memory。input 是 80,000 rows、8 個 Parquet files,掛載到兩個 Worker 都能存取的共享路徑。
application 讀入 input 後執行 repartition(8, "key"),接著對 shuffle 後的 DataFrame 呼叫 cache() 與 count()。repartition 是這篇唯一刻意建立的資料重分配邊界;為了讓 UI 中的八個 partitions 穩定對照程式,實驗關閉 AQE 的 partition coalescing。
Master UI 顯示兩個 Worker 都各自承載一個 Executor,application 共使用 4 cores 與 2 GiB。這是後面所有資料分布的前提。
repartition 先把 input 讀入,再依 key 重組資料repartition(8, "key") 要讓相同 key 的 rows 落到同一個 output partition。原始八個 files 的分布不保證符合這個條件,因此上游 scan tasks 需要把每筆資料依目標 partition 切成 shuffle blocks,先寫到自己 Executor 所在 Worker 的 local disk;下游 tasks 再收集自己所屬 key 範圍的 blocks。
第一次 count() 的 Job 有三個 stages。下圖的 Stage 1 有 4 個 tasks,讀取 850.3 KiB input,並寫出 969.0 KiB shuffle data;Stage 2 有 8 個 tasks,讀回這批 shuffle data。最後的 Stage 3 將各 partition 的局部計數彙整成 count() 結果。
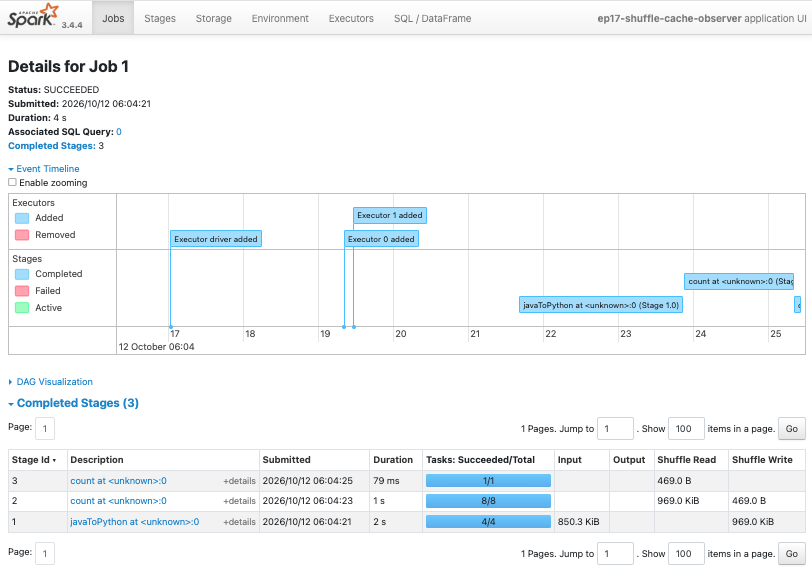
這裡有兩個數字不應混為一談:input 是從共享 Parquet files 讀進來的資料;Shuffle Read/Write 是 stage 之間為了重組資料而交換的中間 blocks。壓縮、序列化與計數的額外 stage 都會讓它們的位元組數不同,不能把其中一個當成原始資料的精確檔案大小。
Spark UI 告訴我有 shuffle,Worker 的 temporary directory 則提供了資料位置的證據。第一次 action 還活著時,我在兩個 Worker 分別找到這類檔案:
# Worker 1
/tmp/spark-.../executor-.../blockmgr-.../15/shuffle_0_1_0.data
/tmp/spark-.../executor-.../blockmgr-.../0f/shuffle_0_1_0.index

# Worker 2
/tmp/spark-.../executor-.../blockmgr-.../36/shuffle_0_2_0.data
/tmp/spark-.../executor-.../blockmgr-.../32/shuffle_0_2_0.index
每次 execution 的 UUID、檔案 hash 目錄與 shuffle ID 都可能不同,因此不該把完整路徑背起來。要記住的是:這些 shuffle_*.data、.index 檔在兩個 Worker 各自的 Executor temporary directory 裡。某個 Executor 寫出的 block 留在它的 local disk;需要該 block 的下游 task 再透過 shuffle fetch 取得它。來源在同一台 Worker 時可以 local read,來源在另一台 Worker 時則由 Executors 經網路傳輸 block。
cache() materialize 後,八個 partitions 留在 Executor memorycache() 只標記「這份 DataFrame 之後值得保存」;第一次 action 才真正計算並儲存它。這次的 count() 同時完成 shuffle 後的資料重組與 cache materialization。
Storage tab 的一列 RDD 代表一份邏輯上的 cached dataset;它的實體內容由 cache 點的多個 output partitions 構成:
repartition(8, "key") 的輸出
├── partition 0 → cache block 0 → 某個 Executor 的 Block Manager
├── partition 1 → cache block 1 → 某個 Executor 的 Block Manager
├── ...
└── partition 7 → cache block 7 → 某個 Executor 的 Block Manager
一台 Worker 可以承載多個 Executors,因此「Executor 的 Block Manager」是精確的擁有者。這次剛好每台 Worker 各有一個 Executor,這 8 個 blocks 也就分散在兩個 Worker 上的 Executors。
Storage tab 顯示 cached RDD 有 8 個 partitions、Fraction Cached 是 100%、Size in Memory 是 2026.1 KiB,Size on Disk 是 0.0 B。

畫面上的 storage level 是 Disk Memory Deserialized 1x Replicated,這是 DataFrame cache() 的預設儲存等級,允許 memory 不足時使用 disk 作為 fallback。本次資料很小,所有 blocks 都放進 memory,因此 disk 用量是 0.0 B。shuffle files 與 cache blocks 由不同的資料生命週期管理;前者仍是 shuffle fetch 使用的中間結果,後者則是可重用的 DataFrame partitions。
這個實驗為了在 executor log 中標出 partition 落在哪個 host,加入了一層 mapPartitions(...).toDF(...) 的觀察用 wrapper。因此 Storage tab 的 RDD name 顯示 Scan ExistingRDD。它是這個觀察程式產生的名稱,判讀重點仍是 8 個 cached partitions 與 memory/disk 的 metrics。
count() 仍有自己的小型 shuffle接著我對同一份 cached DataFrame 執行:
cached_events.filter("key = 7").count()
第二次 action 只得到 4,000 rows,Job 也在 0.6 秒完成。它的 Job Details 顯示 Skipped Stages: 1,其中 upstream 的 Stage 4 是 javaToPython ...,標示 0/4。新的 Stage 5 直接以 8 個 tasks 開始,Input 是 2026.1 KiB,正好對應 Storage tab 的 cache 大小。
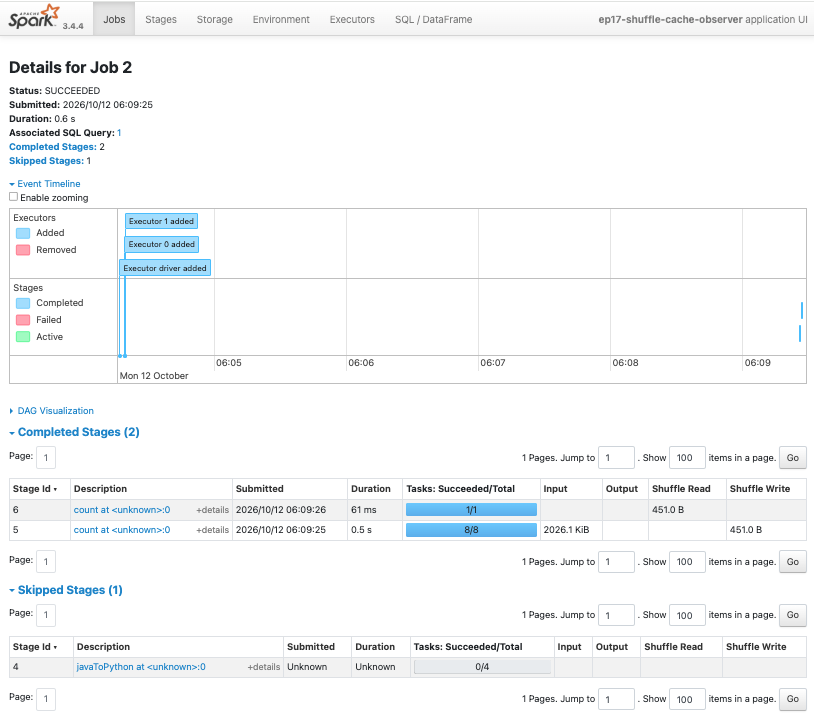
Stage 5 仍寫出 451.0 B,Stage 6 也讀取 451.0 B。這是全域 count() 彙整每個 partition 局部計數所需的小型 shuffle。它和第一次為了 repartition(8, "key") 所做的資料重組是不同層次的工作:第二個 Job 沒有重讀 850.3 KiB 的 Parquet input,也沒有重做第一次的 upstream shuffle。
cache reuse 的證據是 upstream stage 被跳過、下一個 Job 從 cached partitions 開始;後續 action 自己需要的 aggregation 或 shuffle 仍可能存在。
| UI 證據 | 這次代表什麼 | 對應的位置 |
|---|---|---|
Stage 1 的 Input: 850.3 KiB |
Executor 從原始 Parquet input 讀取資料 | shared storage |
Shuffle Write / Shuffle Read |
上游 task 寫出 blocks、下游 task 取得它們 | Executor 所在 Worker 的 local disk;遠端來源需要網路 fetch |
Storage 的 8 cached partitions、2026.1 KiB memory |
一份 cached dataset 的 8 個實體 cache blocks 已 materialize | Executor Block Manager memory |
Job 2 的 Skipped Stages: 1 |
cache 已滿足 upstream 計算,Spark 不必重做 scan 與第一次 shuffle | Driver 依 cached blocks 規劃新的 Job |
以前看到 Spark UI 的 input、shuffle 與 storage 指標時,我很容易把它們都理解成「Spark 正在讀寫資料」。這次把資料位置逐一對起來後,三者的意義清楚很多:input 屬於共享 storage、shuffle 是 Worker local disk 上的短暫中間結果、cache 是 Executor Block Manager 保存下來可重用的 partitions。
下一篇可以繼續追問一件與成本直接相關的事:當需要的 cached block 不在執行 task 的 Executor 上,Spark 如何選擇 task 位置,又何時需要透過網路取得資料?
🚀 GitHub:
Ep17|資料、shuffle、cache 到底落在哪裡?
🚀 spark-learning-lab 系列文章與實作:
https://github.com/jeffery5bai/spark-learning-lab
Apache Spark 3.4.4 — Configuration (spark.local.dir):
https://archive.apache.org/dist/spark/docs/3.4.4/configuration.html#available-properties

 jeffery5bai

 iThome鐵人賽
 看影片追技術