有以下問題想請問各位前輩
想了好久還是不知道該如何寫
以下是我的程式碼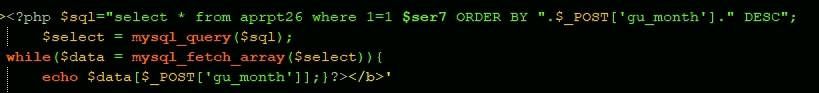
想讓輸出出來的數字,平均給每個圓餅圖
圖上顯示都排列在同一個圓餅圖切片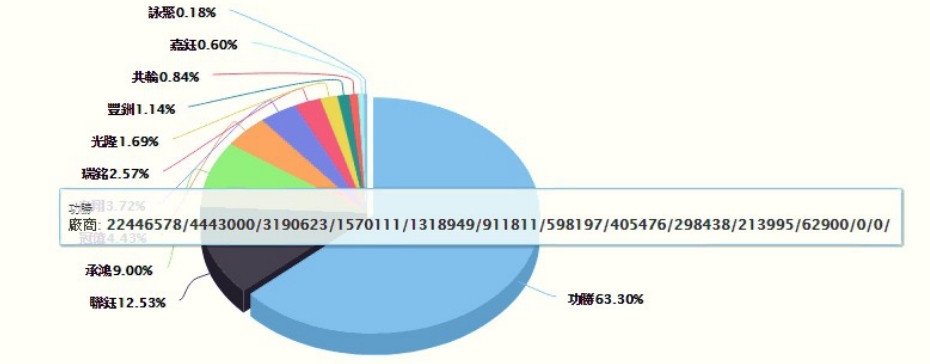
已邀請的邦友 {{ invite_list.length }}/5
選我正解
感謝您的回應
有看過這個模組
但是他上面的%數
我是想寫成數值
也就是%數到底是量多大?
像是60%的話
數值可能是88995
這個88995佔整個圓餅圖的60%
看看JSFiddle是不是你要的
把不要顯示的變數刪掉即可
為免JSFiddle失效
Source code 如下
<script src="https://code.highcharts.com/highcharts.js"></script>
<script src="https://code.highcharts.com/modules/exporting.js"></script>

<div id="container"></div>

$(function () {
	$('#container').highcharts({
		chart: {
			plotBackgroundColor: null,
			plotBorderWidth: null,
			plotShadow: false,
			type:'pie'
		},

		title: {
			text: 'Browsers'
		},

		subtitle: {
			text:false,
		},

		tooltip: {
			pointFormat: '{point.name}/{point.percentage:.1f}%/{point.custom}'
		},

		plotOptions: {
			pie: {
				allowPointSelect: true,
				cursor: 'pointer',
				dataLabels: {
					enabled: true,
					format: '<b>{point.name}</b>: {point.percentage:.1f} % {point.custom}',
					style: {
						color: (Highcharts.theme && Highcharts.theme.contrastTextColor) || 'black'
					}
				}
			}
		},

		series: [{
			name: "Total",
			colorByPoint: true,
			data: [{
				name: "Firefox",
				y: 10,
        custom:"11111"
			}, {
				name: "Chrome",
				y: 12,
         custom:"22222"
			}, {
				name: "Explorer",
				y: 65,
         custom:"33333"
			}, {
				name: "Opera",
				y: 13,
         custom:"44444"
			}]
		}],

	});
});

這圓餅圖我好像有玩過,之前是去D3.js網站找一個來套的,感覺還滿好玩的
海綿寶寶 好久不見啊~!
所以你的問題出在哪?
是數字分配上的問題,
還是畫圖的問題?
數字分配上的問題
在我點選圓餅圖上最大淡藍色第一大塊
想呈現的數字是上面的22446578就好
第二大塊黑色的顯示4443000
現在遇到的問題是,
點每一塊餅圖,
都會顯示每個數值,
而不是依序分配下去。
要看你是用套件還是自己寫的,
用套件的話就看他有沒有提供相關的方法,
只顯示對應的數字就好,
自己寫的話就要針對每一個圓餅區域,
顯示其對應的數字,
另外0的應該不用列出來.
我是拿套件後再試著將自己寫的php程式穿插進去
這個套件原本顯示的是%數
後來我將{point.percentage:.1f} %更改成上述發問的php程式碼
問題應該是出在 tooltip 吧,
如果他的tooltip沒辦法每個分開,
那就沒辦法了,
一定要做的話可以考慮找其他套件試試,
套件這種東西就是,
如果你要特定的功能,
有時候不一定會有...
算是我雞婆,不過切記:不要直接把$_POST收到的東西直接用在SQL查詢字串,這樣會有SQL Injection漏洞。熱門文章剛好有一篇新的文章:[PHP]消毒變數的利器,filter_var和filter_var_array 你可以參考看看。
因為模組原先顯示%數的設定
{point.percentage:.2f}%
是有分開執行的
想說試試看能否改成數值
也可以分開執行
了解!
熱門文章我會再去詳讀
謝謝您的提醒
<!DOCTYPE HTML>
<html>
	<head>
		<meta http-equiv="Content-Type" content="text/html; charset=utf-8">
		<title>Highcharts Example</title>

		<script type="text/javascript" src="http://ajax.googleapis.com/ajax/libs/jquery/1.8.2/jquery.min.js"></script>
		<style type="text/css">
${demo.css}
		</style>
		<script type="text/javascript">
$(function () {
    $('#container').highcharts({
        chart: {
            type: 'pie',
            options3d: {
                enabled: true,
                alpha: 45,
                beta: 0
            }
        },
        title: {
            text: 'Browser market shares at a specific website, 2014'
        },
        tooltip: {
            pointFormat: '{series.name}: <b>{point.percentage:.1f}%</b>'
        },
        plotOptions: {
            pie: {
                allowPointSelect: true,
                cursor: 'pointer',
                depth: 35,
                dataLabels: {
                    enabled: true,
                    format: '{point.name}'
                }
            }
        },
        series: [{
            type: 'pie',
            name: 'Browser share',
            data: [
                ['Firefox',   45.0],
                ['IE',       26.8],
                {
                    name: 'Chrome',
                    y: 12.8,
                    sliced: true,
                    selected: true
                },
                ['Safari',    8.5],
                ['Opera',     6.2],
                ['Others',   0.7]
            ]
        }]
    });
});
		</script>
	</head>
	<body>

<script src="../../js/highcharts.js"></script>
<script src="../../js/highcharts-3d.js"></script>
<script src="../../js/modules/exporting.js"></script>

<div id="container" style="height: 400px"></div>
	</body>
</html>
以上是原套件程式碼
我把我的php輸出串放在pointFormat: '{series.name}的後面
<!DOCTYPE HTML>
<html>
	<head>
		<meta http-equiv="Content-Type" content="text/html; charset=utf-8">
		<title>Highcharts Example</title>

		<script type="text/javascript" src="http://ajax.googleapis.com/ajax/libs/jquery/1.8.2/jquery.min.js"></script>
		<style type="text/css">
${demo.css}
		</style>
		<script type="text/javascript">
$(function () {
    $('#container').highcharts({
        chart: {
            type: 'pie',
            options3d: {
                enabled: true,
                alpha: 45,
                beta: 0
            }
        },
        title: {
			text: '<?php echo "這是依照".$_POST['gu_month']."排序的報表"?>'
        },
        tooltip: {
            pointFormat: '{series.name}: <b><?php $sql="select * from aprpt26 where 1=1 $ser7 ORDER BY ".$_POST['gu_month']."DESC";$select=mysql_query($sql);while($data=mysql_fetch_array($select)){echo $data[$_POST['gu_month']]."/";}?></b>'

        },
        plotOptions: {
            pie: {

                allowPointSelect: true,
                cursor: 'pointer',
                depth: 35,
                dataLabels: {
                    enabled: true,

                    format: '{point.name}<b>{point.percentage:.2f}%</b>'
                }
            }
        },
        series: [{
            type: 'pie',
            name: '廠商',
            data:
			[

				<?php
					echo $m1;
				?>
            ]
        }]
    });
});
		</script>
	</head>
	<body>

<script src="../js/highcharts.js"></script>
<script src="../js/highcharts-3d.js"></script>
<script src="../js/modules/exporting.js"></script>

<div id="container" style="height: 400px"></div>
	</body>
</html>
這是我修改過後的程式碼
你的問題應該是在於
tooltip: {
  pointFormat: '{series.name}: <b>
    <?php
      $sql="select * from aprpt26 where 1=1 $ser7 ORDER BY ".$_POST['gu_month']."DESC";
      $select=mysql_query($sql);
      while($data=mysql_fetch_array($select)){
        echo  $data[$_POST['gu_month']]."/";
      }
    ?>
  </b>'
},
這highchart預期的格式是長這樣
tooltip: {
  pointFormat: '{series.name}: <b>{point.percentage:.1f}%</b>'
},
但你的php看起來回傳的會長這樣
tooltip: {
  pointFormat: '{series.name}: <b>212132/21321510/0/3132</b>'
},
所以把這部分整理成他要的格式應該就好了
沒有提供那部份的資料長怎樣
只能這樣舉例了
補充一下
應該是說你的資料不應該放在 tooltip
而是放在 data 那
然後在 tooltip 那邊去抓對應的欄位出來
舉例來說
chrome 這筆資料長這樣
mycustomLabel假設為你撈完資料庫的資料放這
{
    name: 'Chrome',
    y: 12.8,
    sliced: true,
    selected: true,
    mycustomLabel: 'ithelp-ithelp-ithelp-ithelp'
},
在 tooltips 改成這樣
tooltip: {
    pointFormat: '{series.name}: <b>{point.mycustomLabel}</b>'
},
就能在 chrome 那筆資料的 label 看到結果
codepen範例
我放在回答本文了
data: [
                ['Firefox',   45.0],
                ['IE',       26.8],
                {
                    name: 'Chrome',
                    y: 12.8,
                    sliced: true,
                    selected: true
                },
                ['Safari',    8.5],
                ['Opera',     6.2],
                ['Others',   0.7]
            ]
但在這個地方,我是去撈資料庫裡的資料
所以寫成
data: [
                <?php if($data[$_POST['gu_month']]<>'0'){$m1.= "['".$data['chart_company']."'".",".$data[$_POST['gu_month']] ."],"echo $m1;?>;}
            ]
也就是說
{
                    name: 'Chrome',
                    y: 12.8,
                    sliced: true,
                    selected: true
                },
沒辦法修改到
感謝您的回應
有看過這個模組
但是他上面的%數
我是想寫成數值
也就是%數到底是量多大?
像是60%的話
數值可能是88995
這個88995佔整個圓餅圖的60%
不懂為什麼不行
還是你給我你的資料
我寫個範例給你看?
有機敏資料的話
隨便帶數字就好
重點是欄位
像是60%的話
數值可能是88995
這個88995佔整個圓餅圖的60%
那就是照我上面的範例呀
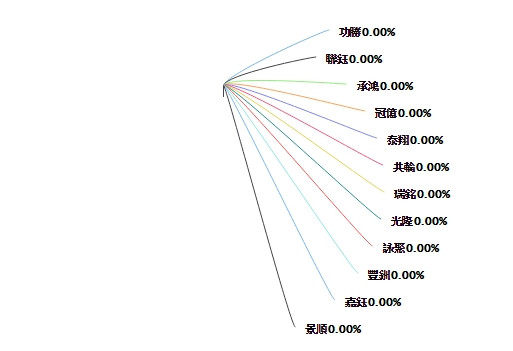
修改好之後
圓餅圖會不見...
私訊 留言 看你囉
我只是想知道你的資料長怎樣
用來舉例
這樣你會比較好了解
e.g.
companyName => 'test'
count => 600
time => 1321156161
之類的
直接 var_dump 你撈完資料庫的資料就好


 iThome鐵人賽