請教各位前輩,如何使用Python或R語言來重新整理Table的資料
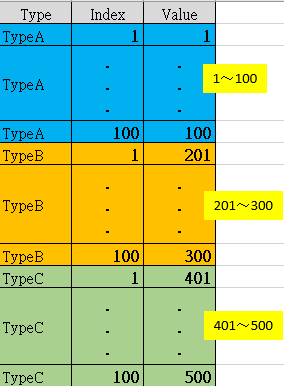
需求:一張Table裡存有多筆Type群組資料,假設每組資料各有100筆資料,各有其值(Value),我想要截取出每組資料集裡Index為95和5的資料,重新匯整為一張Table如圖2所示。
語法很不熟,不知道該怎麼匯整。。。><
圖1.原始資料範例
圖2.預期整理結果
Python or R
dataTable = Document.Data.Tables["myTable"]
rowCount = dataTable.RowCount
rowsToInclude = IndexSet(rowCount, True)
cursor1 = DataValueCursor.CreateFormatted(dataTable.Columns["Count"])
idx=0
for row in dataTable.GetRows(rowsToInclude, cursor1):
    found=False
    aTag = cursor1.CurrentValue
    idx=idx+1

R語言 :
x是你的資料
data = data.frame("Type" = unique(x$Type) , "P95" = x[x$Index == 95,c("Value")] ,"L05" = x[x$Index == 5,c("Value")])
收工!
使用Pandas比較方便。可參考:
https://pandas.pydata.org/pandas-docs/stable/reference/api/pandas.DataFrame.groupby.html
df[(df['Index'] == 5) | (df['Index'] == 95)].groupby(['Type', 'Index']).mean()