大家好,
我想請問D3的座標軸,初始是這樣
但我想改成這樣時
要怎麼修改?
下面是我的code,
let xAxis = d3.axisBottom(xScale)
    .ticks(10)
    .tickFormat(d => d)
    .tickSizeOuter(10)
    .tickSizeInner(0)
    .tickPadding(10)
    //.tickSize(10) 這個沒辦法分別設定 inner 或 outer

let xAxisGroup = svg.append('g')
    .call(scale)
    .attr('transform', `translate(0,0)`)
目前遇到的問題是,
(1)使用.tickSizeOuter(10),也會設定到最後一個tick,無法只設定原點的tick。
(2)使用.tickSizeInner(-100),雖然能畫藍色線,但無法凸出座標軸
我試著去抓節點,並設定 attribute,也是沒辦法。
let xAxisGroup = svg.append('g')
    .call(scale)
    .attr('transform', `translate(0,0)`)

//這裡
const ttt = xAxisGroup.selectAll('.tick>line')

const tttArr = [...ttt]
tttArr.forEach((e,i)=>{
    if(i == 0){
        //試著單獨設定原點的tick
        e.setAttribute("style", 'stroke: Tomato; stroke-width: 3px');
    }
})
所以我想請問的是,如果想設定某一個特定的tick,要怎麼設定呢?
已邀請的邦友 {{ invite_list.length }}/5
嗨~不知道這樣的軸線是不是你想要的樣式呢?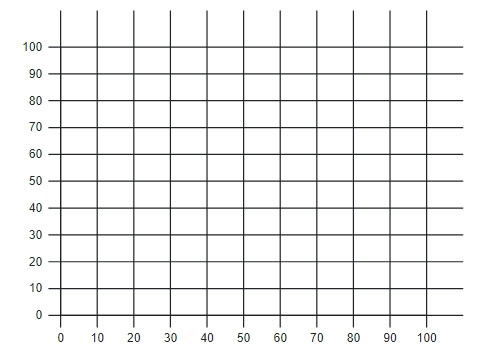
d3.js 提供的 Axis API 有自己的設定,基本上要直接使用它提供的tick相關API去客製化刻度跟軸線會有所侷限,因此有些較複雜的刻度設計會使用繪製兩條軸線的方式去處理。但你想要的刻度不太複雜,我建議用調整css的方法來處理~
以下程式碼提供參考,再跟我說適不適用唷
//html
 <div class="mt-5 wrapper"></div>

 //JS
    const rwdSvgWidth = 500,
        rwdSvgHeight = 300,
        margin = 40;

      // chart SVG
      const svg = d3
        .select(".wrapper")
        .append("svg")
        .attr("width", rwdSvgWidth)
        .attr("height", rwdSvgHeight)
        .style("border", "1px solid rgb(96, 96, 96)");

      // 設定x、y軸比例尺
      const xScale = d3.scaleLinear().domain([0, 100]).range([0, 300]);
      const yScale = d3.scaleLinear().domain([0, 100]).range([220, 0]);

      // 建立x、y軸線
      let xAxis = d3
        .axisBottom(xScale)
        .tickSizeInner(-rwdSvgHeight + margin)
        .tickSizeOuter(0)
        .tickPadding(15);

      let yAxis = d3
        .axisLeft(yScale)
        .tickSizeInner(-(rwdSvgHeight + margin))
        .tickSizeOuter(0)
        .tickPadding(15);

      // x軸線綁訂到DOM
      svg
        .append("g")
        .attr("class", "xAxis")
        .call(xAxis)
        .attr(
          "transform",
          `translate(${margin * 3}, ${rwdSvgHeight - margin})`
        );

      // y軸線綁訂到DOM
      svg
        .append("g")
        .attr("class", "yAxis")
        .call(yAxis)
        .attr("transform", `translate(${margin * 3}, ${margin})`);

      // 調整tick特殊樣式
      d3.selectAll(".yAxis line").attr("transform", "translate(-10,0)");
      d3.selectAll(".xAxis line").attr("transform", "translate(0,10)");


