羅吉斯回歸一般用於資料分類
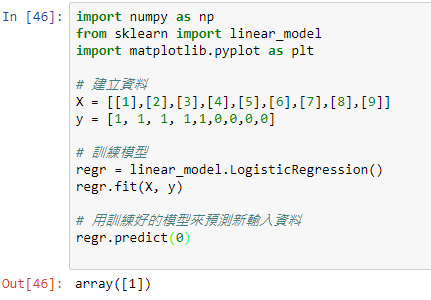
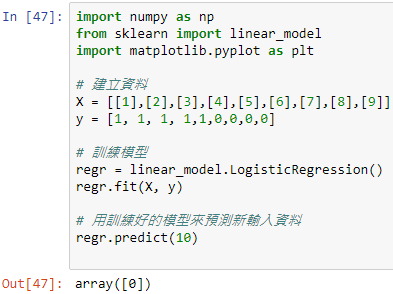
實作將一組數字1~9做標籤(1~5標籤為1、6~9標籤為0)
訓練過後對模型做預測:
輸入0 應該分到左邊1那組
輸入10 應該分到右邊0那組
import numpy as np
from sklearn import linear_model
import matplotlib.pyplot as plt

# 建立資料
X = [[1],[2],[3],[4],[5],[6],[7],[8],[9]]
y = [1, 1, 1, 1,1,0,0,0,0]

# 訓練模型
regr = linear_model.LogisticRegression()
regr.fit(X, y)

# 用訓練好的模型來預測新輸入資料
regr.predict(0)


參考資料來源:
http://terrence.logdown.com/posts/440690-python-super-simple-implementation-of-logistic-regression-classification-and-examples
https://ithelp.ithome.com.tw/articles/10187739
後學才疏學淺,如有謬誤還請各位先進不吝指教。

感覺測試的地方可以多一點樣本
在用小數點的值來測會比較有感覺
好的 感謝建議
每天下班回家後邊看邊寫 時間有限
之後會盡量再寫深入一點 ><