最近在看深度學習的書籍,還好這本書有講一點點基礎Python,對於Python零經驗的我算是一個小確幸。目前也只看了一半,這次筆記主要是紀錄一些自己的疑問和自己的想法,若有地方有誤解請各位糾正。
梯度首先要先提到微分和偏微分,在此沒有講推導部分,只敘述微分和偏微分在這的用處,有興趣可以前往維基百科觀看。
數值微分
什麼是微分?還記得在大一時候我只會算還真的不知道它的用途,現在也只能領悟少許的皮毛。簡單來說假如車子在12小時內跑了60公里,那他的速率就是5,而這速率("變化")就是微分,接下來先看公式和例子。
公式: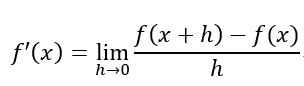
例如車子在12小時跑了60公里,,通常我們都直接微分或在上面公式就可以得到5,這部分就是他f(x)在x變化,但我們在寫程式時候,h趨近於0這時候可能會導致我們除數 = 0,因此使用了兩點分差延伸出三個公式。
公式:
前差
中央差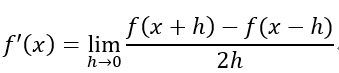
後差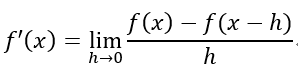
三個都有誤差有興趣可以去看理論,但若不要求非常精準我們還是能拿來使用,當我們取中央差時候我們就可以防止可能除數是等於0的情況。
Python:
# 函數微分 中央分差
def num_diff(f, x):
    h = 1e-4 # 0.0001
    return (f(x + h) - f(x - h)) / (2 * h)
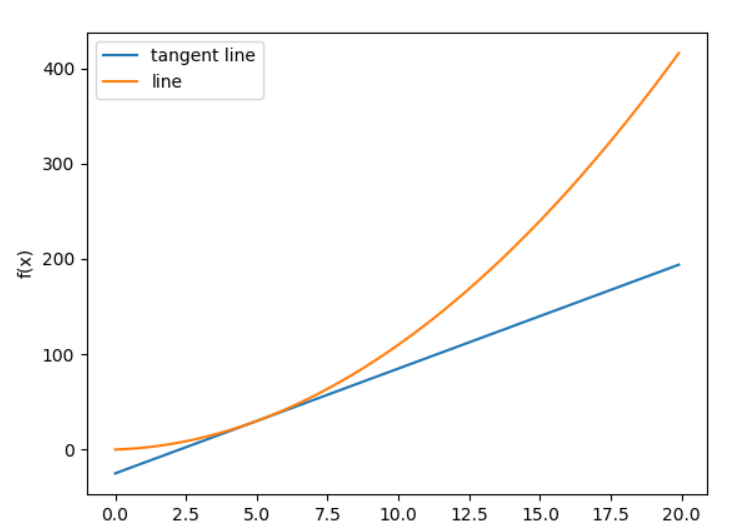
微分後我們得到的其實就是他的切線,可帶入微分的切線方程式如下圖f(x) = x^2 + x。
Python:
# 函數1
def fun_1(x):
    return x ** 2 + x

# 微分切線方程式: y = f(a) + d(x − a) = f(a) - d * a + d * x
# 這部分回傳一個function讓我們可以得到函數再把x帶入.
def tangent_fun(f, a):
    d = num_diff(f, a)
    #print(d)
    y = f(a) - d * a
    return lambda x: d * x + y


x = np.arange(0.0, 20, 00.1)
y = fun_1(x)

tan_fun = tangent_fun(fun_1, 5)
y2 = tan_fun(x)

plt.plot(x, y2, label = "tangent line")
plt.plot(x, y, label = "line")
plt.xlabel("x")
plt.ylabel("f(x)")
plt.legend()
plt.show()
我們知道微分是取得f(x)在x變化,那假如現在的函數是我們就必須使用偏微分而不是微分,我們要求在x的變化和在y的變化,如下圖,可以看出偏微分就是只對一個未知數微分其餘的當作常數,也就是其餘未知數保持不變我們對單一未知數求他的變化。
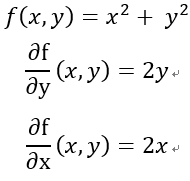
我們把任一方程式未知數的偏微分求出來把它當作向量統計我們稱為梯度,如下圖,梯度他是有大小方向的,而往後這是要拿來更新參數將損失縮小,到目前這裡就是今天要介紹的一個重點,應該有人跟我一樣好奇梯度大小?梯度方向?,今天就要用f(x, y) = x^2 + y^2的梯度來說明給你聽。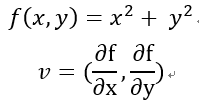
首先我看的這本書他有介紹梯度圖,若程式碼部分忘記公式可以往上拉看微分公式,我們先來看他的梯度求法和圖。
Python:
# 一次算x.y兩個偏微分(梯度)
def num_gradient(f, x):
    grad = np.zeros_like(x)
    h = 1e-4 # 0.0001
    print(x.size)
    for idx in range(x.size):

        tmp_x = x[idx]

        x[idx] = tmp_x + h
        fxh1 = f(x)

        x[idx] = tmp_x - h
        fxh2 = f(x)

        grad[idx] = (fxh1 - fxh2) / (2 * h)
        x[idx] = tmp_x

    return grad

# 計算所有x.y梯度
def num_gradients(f, x):
    grad = np.zeros_like(x)

    for idex, X in enumerate(x):
        grad[idex] = num_gradient(f, X)
    return grad

if __name__ == '__main__':
    x = np.arange(-2.0, 2.0, 1.0)
    y = np.arange(-2.0, 2.0, 3.0)

    #將x和y擴展當相同大小.再轉一維
    X, Y = np.meshgrid(x, y)
    X = X.flatten()
    Y = Y.flatten()

    #求梯度
    grad = num_gradients(fun_1, np.array([X, Y]))

    print(X)
    print(Y)
    print(grad)

    #畫出quiver方向圖, xlim指定顯示大小, label標籤顯示, grid顯示網格
    plt.quiver(X, Y, grad[0], grad[1],  angles="xy",color="#666666")
    plt.xlim([-4, 4])
    plt.ylim([-4, 4])
    plt.xlabel('x0')
    plt.ylabel('x1')
    plt.grid()
    plt.draw()
    plt.show()
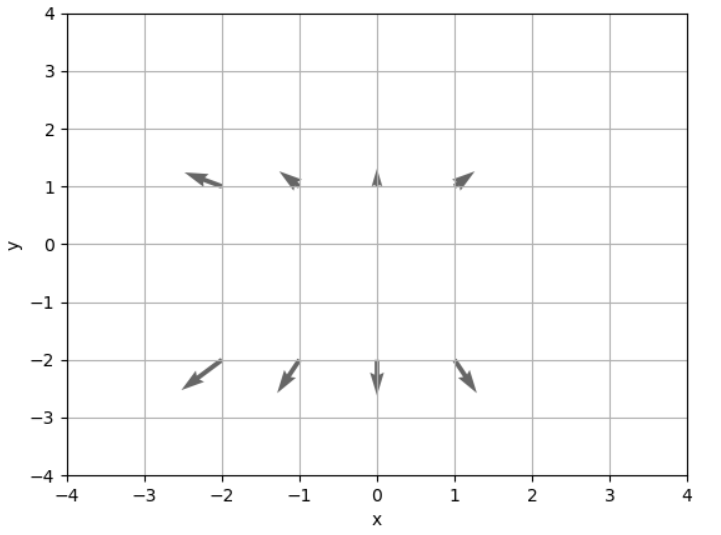
以上數據:
x = [-2. -1. 0. 1. -2. -1. 0. 1.]
y = [-2. -2. -2. -2. 1. 1. 1. 1.]
x偏 = [-4. -2. 0. 2. -4. -2. 0. 2.]
y偏 = [-4. -4. -4. -4. 2. 2. 2. 2.]
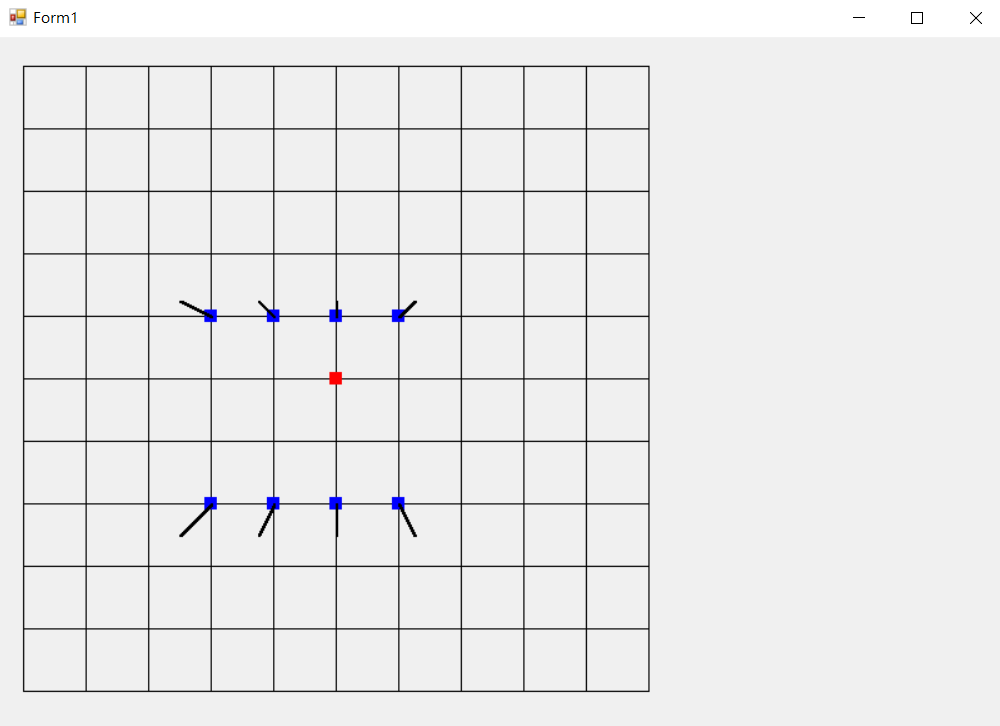
我想有人會跟我一樣有疑問我們知道偏微分.梯度那圖示怎畫出來的? 以下為你解釋。
還記得小學補習班的Boss教數學時跟我說過"大膽假設,小心求證"不要怕算錯,雖然這句話由來不是他的,但對我而言告訴我這句話就是補習班Boss交給我的,真是難忘的回憶。首先我們可以知道偏微分出來的x和y的搭配就很像是第一象限到第四象限的組合,這時候我們就可以得到箭頭要往哪個象限延伸,然而角度我們可以用atan來取得因為我們有x和y,而長度則是計算我們目前全部座標的兩個向量最大總和來當分母,分子則是當下兩個向量目前最大值,例如,|a| = (-3, 4), |b| = (1, 2), |c| = (2, 4), 這時候我們可以得知|a|向量是目前最大的abs(-3) + abs(4) = 7,對於全部向量來說7就是分母,假如,當我們要畫出b向量時候我們就要畫2 / 7因為|b|向量的第二個向量比第一個大所以我們拿來當分子,所以當我們要畫|c|長度是4 / 7,以下讓我們用C#將我們梯度可視化。
class PointF2D
{
    private float _x;
    private float _y;

    public PointF2D(float x, float y)
    {
        _x = x;
        _y = y;
    }

    public PointF2D()
    {
        _x = 0;
        _y = 0;
    }

    public float X
    {
        get
        {
            return _x;
        }
        set
        {
            _x = value;
        }
    }

    public float Y
    {
        get
        {
            return _y;
        }
        set
        {
            _y = value;
        }
    }
}
interface Function
{
    float Formula(float x, float y);
}

class Function1 : Function
{
    public float Formula(float x, float y)
    {
        return x * x + y * y;
    }
}
可以使用多載參數帶PointF2D。
PointF2D Fun(Function fun, float x, float y)
{
    PointF2D grad = new PointF2D();
    float fun1 = 0.0f;
    float fun2 = 0.0f;
    float h = 1e-4f;

    fun1 = fun.Formula((x + h), y);
    fun2 = fun.Formula((x - h), y);
    grad.X = (fun1 - fun2) / (h * 2);

    fun1 = fun.Formula(x, (y + h));
    fun2 = fun.Formula(x, (y - h));
    grad.Y = (fun1 - fun2) / (h * 2);

    return grad;
}
可以使用多載參數帶PointF2D。
drawGradient函數:
這是裡面最主要的函數,用來計算長度的,目前沒有優化。
1.因我們得知x向量y向量所以可以使用atan取得弧度(得到我們要畫的角度)。
2.之後我們可以先計算Cos和Sin用來取的邊長資訊。
3.取的x.y的方向(Direction)也就是要畫哪個象限。
4.maxLen計算要畫多長。
5.index是目前我們要畫的長度因此斜邊(bevel) = index / Cos。(Cos = 鄰/斜 推算)。
6.x乘上方向.y = Sin * 斜邊(Sin = 對/斜 推算)在乘上方向。
7.直到畫到我們目前最大長度。
class DrawF
{
    PointF2D _center;
    float _offset;

    public DrawF(float offset)
    {
        _center = new PointF2D(5.0f * offset, 5.0f * offset);
        _offset = offset;
    }

    public DrawF(float offset, float x, float y)
    {
        _center = new PointF2D(x * offset, y * offset);
        _offset = offset;
    }

    public PointF2D getBlockPoint(float x, float y)
    {
        PointF2D point = new PointF2D();
        point.X = (_center.X / _offset + x) * _offset;
        point.Y = (_center.Y / _offset - y) * _offset;
        return point;
    }

    public PointF2D Center
    {
        get
        {
            return _center;
        }
    }

    public void drawBlock(Graphics graphics
                        , float x, float y)
    {
        Pen pen = new Pen(Color.FromArgb(255, 0, 0, 0), 1);
        float xLen = x * _offset;
        float yLen = y * _offset;

        // 水平的分割出垂直數量
        for (int row = 0; row <= x; row++)
        {
            graphics.DrawLine(pen, 0, row * _offset, yLen, row * _offset);
        }

        // 垂直的分割出水平數量
        for (int col = 0; col <= y; col++)
        {
            graphics.DrawLine(pen, col * _offset, 0, col * _offset, xLen);
        }
    }

    public void drawLine(Graphics graphics
                        , float xS, float yS
                        , float xE, float yE)
    {
        Pen pen = new Pen(Color.FromArgb(255, 178, 34, 34), 5);
        graphics.DrawLine(pen, xS, yS, xE, yE);
    }

    public void drawPoint(Graphics graphics, Brush color
                        , float x, float y)
    {
        graphics.FillRectangle(color, x - 5.0f, y - 5.0f, 10.0f, 10.0f);
    }

    public void drawPointLine(Graphics graphics, Brush color
                            , float x, float y)
    {
        graphics.FillRectangle(color, x, y, 2.0f, 2.0f);
    }

    // drawGradient畫一個梯度
    // point: 座標
    // U: x向量
    // V: y向量
    // maxSum: 最大向量和
    public void drawGradient(Graphics graphics
                            , PointF2D point
                            , float U, float V, float maxSum)
    {
        // 鄰邊 = U = x
        // 對邊 = V = y
        float absU = Math.Abs(U);
        float absV = Math.Abs(V);

        // atan取弧度(tan = 對邊 / 鄰邊
        float radian = absU != 0 ? (float)Math.Atan(absV / absU) : (float)(Math.PI * 0.5);
        Console.WriteLine(radian / Math.PI * 180);

        // cos = 鄰邊 / 斜邊, sin = 對邊 / 斜邊
        float xCos = U != 0.0f ? (float)Math.Cos(radian) : 1.0f;
        float ySin = V != 0.0f ? (float)Math.Sin(radian) : 0.0f;

        float xDirection = U < 0.0f ? -1.0f : U > 0 ? 1.0f : 0.0f;
        float yDirection = V < 0.0f ? 1.0f : V > 0 ? -1.0f : 0.0f;


        // 計算顯示長度比例
        float max = absU > absV ? absU : absV;
        float maxLen = (max / maxSum * _offset);

        for (float index = 0; index < maxLen; index += 0.01f)
        {
            // 取得斜邊
            // 取得x + 方向和y + 方向(對邊)
            float bevel = index / xCos;
            float x = index * xDirection;
            float y = ySin * bevel * yDirection;

            if (Math.Abs(y) > maxLen)
            {
                return;
            }

            drawPointLine(graphics, Brushes.Black, point.X + x, point.Y + y);
        }
    }

    // drawGradient畫一個梯度(多載)
    // point: 座標
    // U: x向量
    // V: y向量
    public void drawGradient(Graphics graphics
                            , PointF2D point
                            , float U, float V)
    {
        float sum = Math.Abs(V) + Math.Abs(U);
        drawGradient(graphics, point, U, V, sum);
    }

    // drawGradients畫出所有梯度
    // xyPoints: 座標陣列
    // uvPoints: 向量陣列
    public void drawGradients(Graphics graphics
                            , ArrayList xyPoints
                            , ArrayList uvPoints)
    {
        float maxUV = getMaxUV(uvPoints);

        for (int index = 0; index < xyPoints.Count; index++)
        {
            PointF2D xyPoint = (PointF2D)xyPoints[index];
            PointF2D uvPoint = (PointF2D)uvPoints[index];

            drawGradient(graphics, xyPoint, uvPoint.X, uvPoint.Y, maxUV);
        }
    }

    // getMaxUV取得目前最大向量
    // uvPoints: 向量陣列
    private float getMaxUV(ArrayList uvPoints)
    {
        float maxUV = 0.0f;

        for (int index = 0; index < uvPoints.Count; index++)
        {
            PointF2D uvPoint = (PointF2D)uvPoints[index];
            float sum = Math.Abs(uvPoint.X) + Math.Abs(uvPoint.Y);
            if (maxUV < sum)
            {
                maxUV = sum;
            }
        }

        return maxUV;
    }
}
private void pictureBox1_Paint(object sender, PaintEventArgs e)
{
    DrawF draw = new DrawF(50.0f, 5.0f, 5.0f);
    draw.drawBlock(e.Graphics, 10.0f, 10.0f);
    draw.drawPoint(e.Graphics, Brushes.Red, draw.Center);

    ArrayList xyPoints = new ArrayList();
    ArrayList uvPoints = new ArrayList();

    float[] x = { -2, -1, 0, 1, -2, -1, 0, 1 };
    float[] y = { -2, -2, -2, -2, 1, 1, 1, 1 };

    Function1 fun = new Function1();

    for (int index = 0; index < 8; index++)
    {
        PointF2D xyPoint = draw.getBlockPoint(x[index], y[index]);
        PointF2D uvPoint = Fun(fun, x[index], y[index]);
        Console.Write(uvPoint.X + " " + uvPoint.Y);
        xyPoints.Add(xyPoint);
        uvPoints.Add(uvPoint);
        draw.drawPoint(e.Graphics, Brushes.Blue, xyPoint);
    }

    draw.drawGradients(e.Graphics, xyPoints, uvPoints);
}
放大50倍繪製10x10方格(5, 5)紅色點為中心。
上面函數很多沒優化,但或許這樣會比較好,優化雖然會增加效率但也會減少可讀性,接下來希望有時間能把深度學習看完,今天已經混一天但還是把文章寫出來了,祝大家假日愉快。
 Kevin
Kevin

 iThome鐵人賽