之前介紹的神經網路這篇參考文獻,裡面他做出一個動態更新的神經網路訓練,覺得相當有趣,因此嘗試利用canvas來實現動態更新的效果。
這次介紹主要都是座標繪製也無用到特別公式,所以文字部分比較少幾乎都是程式碼。
[筆記]深度學習(Deep Learning)-神經網路學習
繼上次神經網路學習轉Javascript版本,如下。
// network.js

const Network = function () {
    this.TAG = "Network";
};

Network.prototype = {

    sigmoid: function (x) {
        return 1.0 / (1.0 + Math.exp(-x));
    },

    fun: function (x, w, b) {
        return x * w + b;
    },

    loss: function (x, w, b) {
        const a = this.fun(x, w, b);
        const y = this.sigmoid(a);

        return 0.5 * (y * y);
    },

    getGrad: function (x, w, b) {
        const h = 1e-2;
        let grad = [];
        let temp = 0.0;
        let fun1 = 0.0;
        let fun2 = 0.0;

        temp = w;
        w = temp + h;
        fun1 = this.loss(x, w, b);
        w = temp - h;
        fun2 = this.loss(x, w, b);
        w = temp;
        grad.dW = (fun1 - fun2) / (2.0 * h);

        temp = b;
        b = temp + h;
        fun1 = this.loss(x, w, b);
        b = temp - h;
        fun2 = this.loss(x, w, b);
        b = temp;
        grad.db = (fun1 - fun2) / (2.0 * h);
        return grad;
    },

    tran: function (x, w, b) {
        const lr = 0.15;
        const times = 300;

        let history = [];
        for (let index = 0; index < 300; index++) {
            let a = this.fun(x, w, b);
            let y = this.sigmoid(a);
            let data = { y: y, w: w, b: b };
            history.push(data);
            let grad = this.getGrad(x, w, b);
            w -= lr * grad.dW;
            b -= lr * grad.db;
        }

        return history
    },
};
這次選擇把函數拉出來處理,主要有繪製線條.圓形.箭頭,canvas原函數這篇。
註:箭頭45度所以直接加就好不用計算sin和cos。(45度性質1:1:sqrt(2))
// draw.js

// 繪製箭頭
// drawArrow params:
// ctx: 繪製圖塊
// x: x位置
// y: y位置
// len: 繪製長度
// type: 繪製方向
function drawArrow(ctx, x, y, len, type) {
    ctx.beginPath();

    switch (type) {
        case 'up':
            ctx.moveTo(x, y);
            ctx.lineTo(x + len, y + len);
            ctx.moveTo(x, y);
            ctx.lineTo(x - len, y + len);
            break;
        case 'down':
            ctx.moveTo(x, y);
            ctx.lineTo(x + len, y - len);
            ctx.moveTo(x, y);
            ctx.lineTo(x - len, y - len);
            break;
        case 'left':
            ctx.moveTo(x, y);
            ctx.lineTo(x + len, y + len);
            ctx.moveTo(x, y);
            ctx.lineTo(x + len, y - len);
            break;
        case 'right':
            ctx.moveTo(x, y);
            ctx.lineTo(x - len, y + len);
            ctx.moveTo(x, y);
            ctx.lineTo(x - len, y - len);
            break;
    }

    ctx.closePath();
    ctx.stroke();
}

// 繪製線條
// drawLine params:
// ctx: 繪製圖塊
// sX: x起始位置
// sY: y起始位置
// eX: x終點位置
// eY: y終點位置
// color: 繪製顏色
function drawLine(ctx, sX, sY, eX, eY, color) {

    ctx.beginPath();

    ctx.moveTo(sX, sY);
    ctx.lineTo(eX, eY);

    ctx.closePath();
    ctx.stroke();
    ctx.strokeStyle = color;
}

// 繪製圓形
// drawRound params:
// ctx: 繪製圖塊
// x: 原心x位置
// y: 原心y位置
// radius: 半徑大小
function drawRound(ctx, x, y, radius) {
    ctx.beginPath();
    ctx.arc(x, y, radius, 0, Math.PI * 2, true);
    ctx.closePath();
    ctx.stroke();
}
1.輸入的文字。
2.線條 + 箭頭。
3.圓形。
4.線條 + 箭頭。
6.輸出的文字。
1.y軸線條 + 箭頭。
2.x軸線條 + 箭頭。
3.x.y文字。
// network-view.js

const _startX = 10;
const _startY = 100;
const _endX = 350 + _startX;
const _endY = 350 + _startY;

// 繪製坐標系.神經網路
function init() {
    const canvas = document.getElementById('stockGraph');
    const ctx = canvas.getContext('2d');

    netCanvasInit(ctx);

    ctx.fillText('y', _startX, _startY - 10);
    drawLine(ctx, _startX, _startY, _startX, _endY, '#000');


    ctx.fillText('x', _endX + 10, _endY);
    drawLine(ctx, _startX, _endY, _endX, _endY, '#000');

    drawArrow(ctx, _startX, _startY, 8, 'up');
    drawArrow(ctx, _endX, _endY, 8, 'right');
}

// 繪製神經網路
// netCanvasInit params:
// ctx: 繪製圖塊
function netCanvasInit(ctx) {
    const x = _startX / 2;
    const y = _startY / 2;
    const radius = y / 2.4;
    const fixY = (radius * 2 + y) / 2;
    const fixX = x + 2 * radius;

    ctx.font = '20px serif';

    ctx.fillText('Input:', x, y);
    ctx.fillText('1.0', x + 50, y);


    drawLine(ctx, x + 100, fixY, x + 200, fixY, '#000');
    drawArrow(ctx, x + 200, fixY, 8, 'right');

    ctx.fillText('W:', x + 115, y * 1.5);
    ctx.fillText('0', x + 145, y * 1.5);

    drawRound(ctx, fixX + 200 - radius, fixY, radius);

    drawLine(ctx, fixX + 200, fixY, fixX + 300, fixY, '#000');
    drawArrow(ctx, fixX + 300, fixY, 8, 'right');

    ctx.fillText('b:', fixX + 220, y * 1.5);
    ctx.fillText('0', fixX + 240, y * 1.5);

    ctx.fillText('Output:', fixX + 310, y);
    ctx.fillText('0', fixX + 380, y);
}
更新主要運用文章介紹的requestAnimationFrame定時更新。
1.檢查是否在運行中.輸入資料。
2.添加線條對應的顏色圖示。
3.取得神經網路資料。
4.繪製神經網路訓練300次的坐標系(x = 次數,y = 訓練結果)。
5.繪製神經網路的w和b的變化。
// network-view.js
let _drawRun = false;
let _event = null;

function run() {
    // 檢查.初始化參數
    if (_drawRun) {
        return;
    }

    const params = {
        w: parseFloat(document.getElementById('text_w').value),
        b: parseFloat(document.getElementById('text_b').value),
        color: document.getElementById('text_color').value
    };

    const msg = checkMSG(params);

    if (msg != "Y") {
        alert(msg);
        return;
    }

    // 線條顏色標示
    addMark(params);

    // 初始化資料
    let network = {};
    network.__proto__ = Network.prototype;
    Network.call(network);

    const datas = {
        data: network.tran(1.0, params.w, params.b),
        index: 0,
        lastY: _startY + 10
    };

    // 繪圖
    const canvas = document.getElementById('stockGraph');
    const ctx = canvas.getContext('2d');

    _drawRun = true;
    _event = window.requestAnimationFrame(function () { draw(ctx, params.color, datas) });
}

// 檢查 w.b.color
// checkMSG params:
// params: 相關資料
function checkMSG(params) {
    if (isNaN(params.w)) {
        return "w 格式錯誤";
    }

    if (isNaN(params.b)) {
        return "b 格式錯誤";
    }

    for (let index = 1; index < params.color.length; index++) {
        if (params.color[index] > 'f') {
            return "color 格式錯誤";
        }
    }

    return "Y";
}

// 繪製二維和神經網路
// draw params:
// ctx: 繪製圖塊
// color: 繪製顏色
// datas: 神經網路資料
function draw(ctx, color, datas) {
    if (datas.index >= datas.data.length) {
        _drawRun = false;
        window.cancelAnimationFrame(_event);
        return;
    }

    const nowY = (_endY - _startY) * (1 - datas.data[datas.index].y) + _startY + 10;

    drawLine(ctx, _startX + datas.index, datas.lastY, _startX + datas.index + 1, nowY, color);
    updateNet(ctx, datas.data[datas.index]);

    datas.lastY = nowY;
    datas.index++;
    _event = window.requestAnimationFrame(function () { draw(ctx, color, datas) });
}

// 繪製神經網路目前參數
// updateNet params:
// ctx: 繪製圖塊
// data: 神經網路目前資料
function updateNet(ctx, data) {
    const x = _startX / 2;
    const y = _startY / 2;
    const offset = 20;
    const radius = y / 2.4;
    const fixY = y * 1.5;
    const fixX = x + 2 * radius;

    ctx.clearRect(x + 145, fixY - offset, 50, offset * 2);
    ctx.fillText(data.w.toFixed(2), x + 145, y * 1.5);

    ctx.clearRect(fixX + 240, fixY - 20, 50, offset * 2);
    ctx.fillText(data.b.toFixed(2), fixX + 240, fixY);

    ctx.clearRect(fixX + 380, y - 20, 50, offset * 2);
    ctx.fillText(data.y.toFixed(2), fixX + 380, y);
}

// 繪製線條對應的圖示
// addMark params:
// params: 神經網路輸入資料
function addMark(params) {
    const html = "<li><div style='background:" + params.color + "'></div> w:" + params.w.toFixed(2) + ", b:" + params.b.toFixed(2) + "</li>";

    document.getElementById('mark_list').innerHTML += html;
    randomData();
}

// 更換隨機輸入資料
function randomData() {
    document.getElementById('text_color').value = getRandomColor();
    document.getElementById('text_w').value = (Math.random() * 2).toFixed(2);
    document.getElementById('text_b').value = (Math.random() * 2).toFixed(2);
    colorChange();
}

// 取得隨機顏色
function getRandomColor() {
    return "#" + Math.floor(Math.random() * 0xffffff).toString(16);
}

// 更換區塊顏色
function colorChange() {
    const color = document.getElementById('text_color').value;
    document.getElementById('color_div').style.background = color;
}
/* index.css */
body {
    text-align: center;
}

.btn-style1 {
    border-radius: 5px;
    background: #5fc0fb;
    border: #5fc0fb 1px solid;
    color: #fff;
    cursor: pointer;
    padding: 5px;
}

    .btn-style1:hover {
        background: #21abff;
    }

    .btn-style1:focus {
        outline: none;
        border-color: #21abff;
        box-shadow: 0 0 5px #21abff;
    }

.text-style1 {
    border-radius: 5px;
    padding: 5px;
    border: solid 1px #bababa;
    vertical-align: middle;
}

    .text-style1:focus {
        outline: none;
        border-color: #5eb6ff;
        box-shadow: 0 0 5px #5eb6ff;
    }


#mark_list {
    display: inline-block;
    width: 150px;
    margin: 0;
}

    #mark_list > li {
        list-style-type: none;
    }

        #mark_list > li > div {
            width: 10px;
            height: 10px;
            background: #2894ff;
            display: inline-block;
            vertical-align: middle;
        }
<!DOCTYPE html>
<html xmlns="http://www.w3.org/1999/xhtml">
<head>
    <meta http-equiv="Content-Type" content="text/html; charset=utf-8" />
    <title></title>
    <script src="network.js"></script>
    <script src="draw.js"></script>
    <script src="network-view.js"></script>
    <link href="index.css" rel="stylesheet" />
</head>
<body onload="init();">

    <div style="padding:10px;">
        <ul id="mark_list">
        </ul>
        <canvas id="stockGraph" width="600px" height="460px"></canvas>
    </div>
    <div>
        <label>w:</label>
        <input type="text" id="text_w" class="text-style1" value="2" " />

        <label>b:</label>
        <input type="text" id="text_b" class="text-style1" value="2" " />

        <input type="text" id="text_color" class="text-style1" value="#2894ff" onchange="colorChange();" oninput="colorChange();" />
        <div id="color_div" style="width:30px; height:30px; background:#2894ff; display:inline-block; vertical-align: middle;"></div>

        <input type="button" class="btn-style1" value="Run" onclick="run();" />
    </div>

</body>
</html>
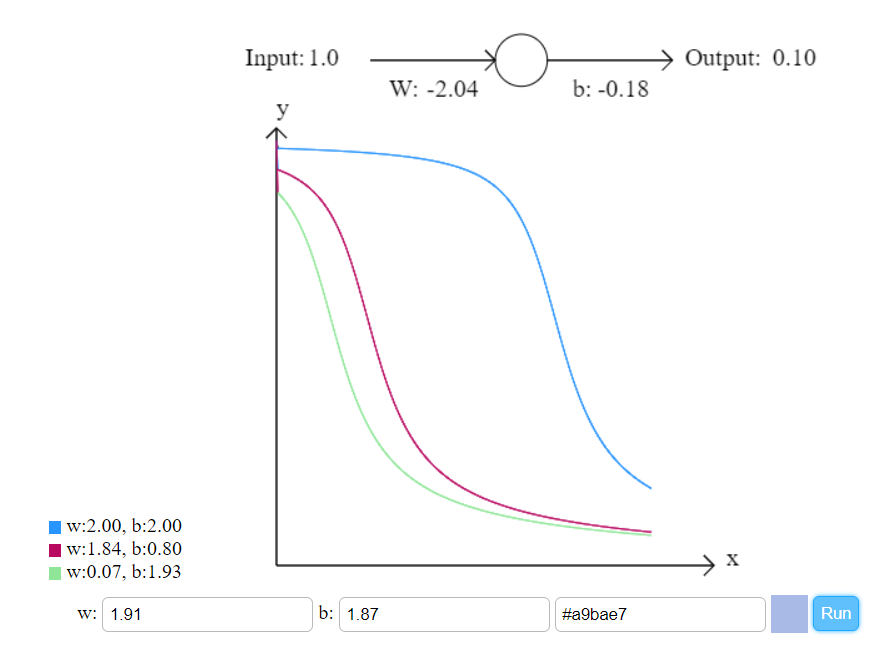
用這樣一個方式可以讓人看到更新過程,這比較適合用來基礎教學,因為若權重變為二維陣列神經網路圖的部分就要繪製更多,主要是觀看也不方便,但我想如果剛學神經網路看到這個動態圖也會比較有興趣繼續學習下去。
[1]Canvas函數。檢自https://developer.mozilla.org/zh-TW/docs/Web/API/Canvas_API/Tutorial (2018.09.01)。
 Kevin
Kevin

 iThome鐵人賽