這次使用Tensorflow不熟花了比較多時間(一直找官網API....),我想很多人都有點痛恨用個迴圈就能快速解決了但在python中迴圈的速度其實就並不快,而Tensorflow主要是用圖表示,也就是說迴圈部分要盡量避免掉(跑回圈會跑出一堆圖),要盡量使用張量來運算才不會消耗太多時間。但也因為沒使用迴圈,程式碼看起來很簡潔,這也算是好處之一。
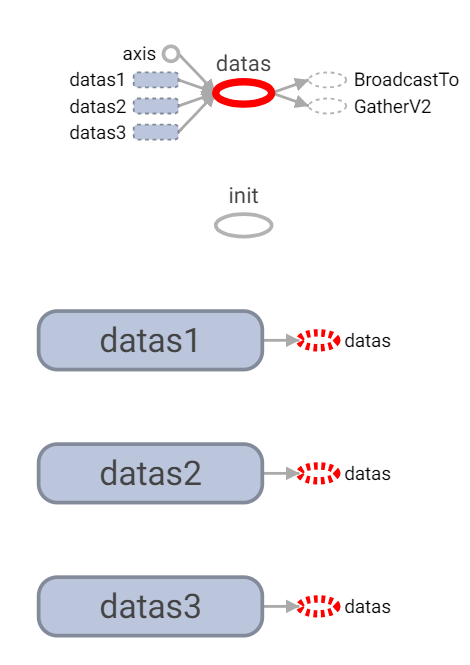
1.datas1、datas2、datas3為初始化點。
2.datas為使用concat將資料串起。
3.center_datas為隨機中心點(這裡固定)。
4.input_center為輸入佔位符。
5.train_op為訓練函數(後面介紹)。
6.畫目前圓心點(紫色)。
# init
datas1 = tf.random_uniform([10, 2], minval=0, maxval=5, name="datas1")
datas2 = tf.random_uniform([10, 2], minval=10, maxval=15, name="datas2")
datas3 = tf.random_uniform([10, 2], minval=20, maxval=25, name="datas3")
datas = tf.concat([datas1, datas2, datas3], axis=0, name="datas")
center_datas = np.array([[1, 1], [11., 11.], [17., 17.]])
input_center = tf.placeholder(tf.float32, shape=[center_datas.shape[0], 2], name="input_center")

train_op = train(input_center, datas)

plt.plot(center_datas[:,0], center_datas[:,1], 'mo')
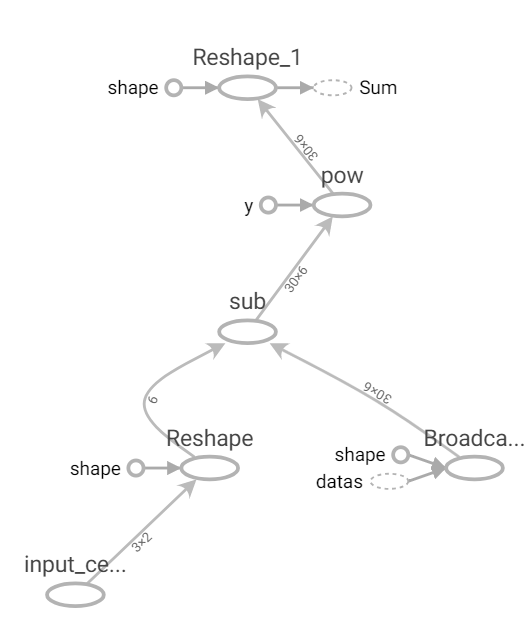
這裡我使用broadcast_to將訓練資料複製到與center_datas一樣大小,這樣就可以很方便做矩陣減法運算,然後在使用reshape將資料依照data數量分群轉為三維陣列,最後在使用第三維去做總和結果即是每個訓練資料對每個點的結果。
1.col_size為計算center_datas大小。
2.將center_datas轉維一維大小即是col_size(後面計算會自動擴展)。
3.使用廣播(擴展)broadcast_to,將data的座標(向量)往右擴展至col_size。
4.計算上述兩者的平方差。
5.轉至大小[data數量,-1(這裡為col_size / 2) 2]。
6.使用第三維計算每個座標(向量)差的和。
def distance(center_datas, data):
    col_size = center_datas.shape[1] * center_datas.shape[0]
    diff = (tf.reshape(center_datas, [-1]) - tf.broadcast_to(data, [data.shape[0], col_size])) ** 2

    return tf.reduce_sum(tf.reshape(diff, [data.shape[0], -1, 2]), axis=2)
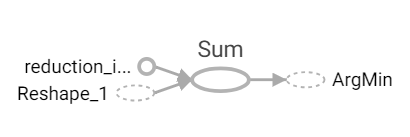
1.取得每個點與中心點的距離。
2.對第二維取最小值,即是目前離最近的值。
def predict(center_datas, data):
    distances = distance(center_datas, data)

    return tf.argmin(distances, axis=1)
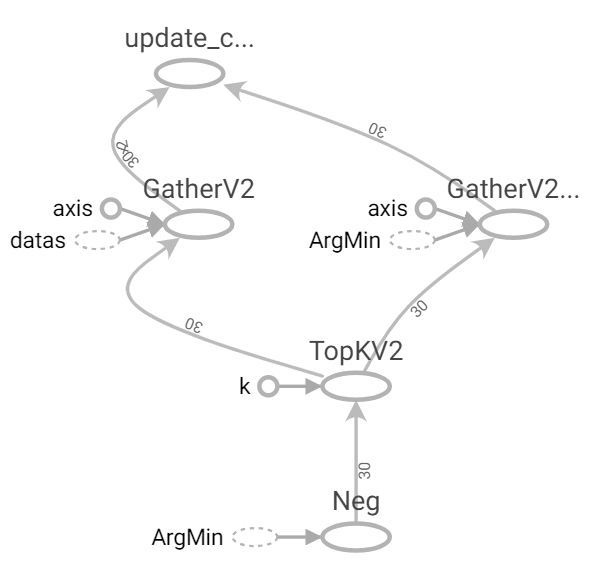
這裡使用segment_mean函數,會依照給的segment_ids參數去做分類並且平均。但它有個限制segment_ids必須經過小到大排序否則會拋錯。
註:這裡算有個BUG,如果預測沒有某群,則segment_mean則不會分到。
1.先使用negative將值轉為負,在使用top_k(大到小排序)取出原先的索引。
2.使用gather取出對應的datas和sort_predicts。
3.使用segment_mean分組計算平均(segment_ids=sort_predicts)。
def update(datas, predicts):
    indices = tf.nn.top_k(tf.negative(predicts), k=datas.shape[0]).indices
    sort_datas = tf.gather(datas, indices)
    sort_predicts = tf.gather(predicts, indices)
    return tf.math.segment_mean(sort_datas, sort_predicts, name="update_center")
1.預測。
2.更新權重。
def train(center_datas, datas):
    predicts = predict(center_datas, datas)

    return update(datas, predicts)
1.訓練至設置times次即可。這裡可使用repeat將中心點修正至原先大小。
# train
for time in range(times):
    center_datas = session.run(train_op, feed_dict={input_center:center_datas})
    # using numpy "repeat" or other  method
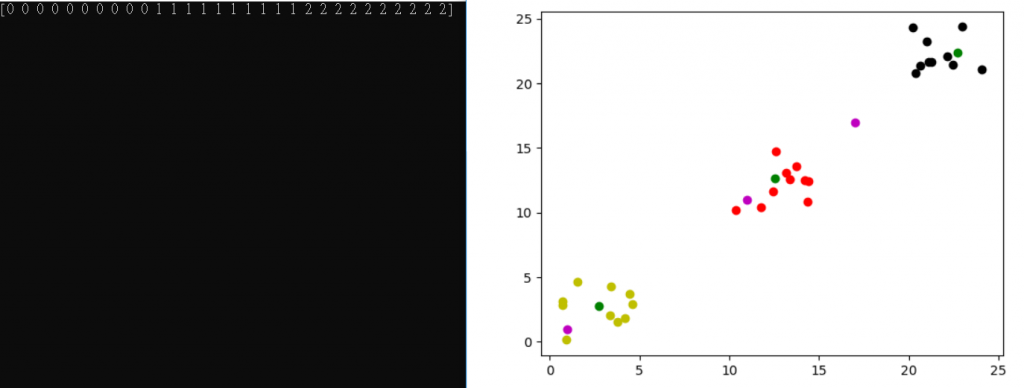
上圖,紫色為原先座標,綠色為更新後的群中心,其他為預測結果。
這次轉個方向使用張量來處理算是滿有收穫的,因原先我是使用別的語言實作,很多地方都只要用for迴圈就能很快處理完,但張量要用矩陣的方式去思考,對我而言算是個不錯訓練,等比較有時間再補上完整程式碼下載。若有錯誤或疑問歡迎留言或私訊。
[1] https://www.tensorflow.org/api_docs/python/tf
 Kevin
Kevin

 iThome鐵人賽