Hi! 大家好,我是Eric,上篇教大家如何用Python畫折線圖了,這次要教大家畫長條圖。

1. 載入套件。
import numpy as np                # 資料處理套件
import pandas as pd               # 資料處理套件
import matplotlib.pyplot as plt   # 資料視覺化套件
2. 載入資料。
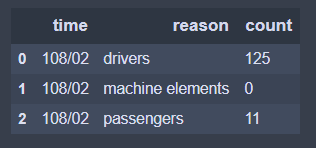
accident = pd.read_csv("number of car accident in three years.csv")
accident.head(3)    # 顯示前3筆資料
3. 開始畫圖。
col_count = 3                  # 由於有3個月,設定類別基數為3
bar_width = 0.2                # 設定長條圖每個長條寬度
index = np.arange(col_count)   # 依據3個類別(3個月)設定索引值,便於後續長條圖的位置設定

# 自原始資料中分別擷取5個肇事原因的件數
A = accident[accident.reason == "drivers"]["count"]
B = accident[accident.reason == "machine elements"]["count"]
C = accident[accident.reason == "passengers"]["count"]
D = accident[accident.reason == "facility"]["count"]
E = accident[accident.reason == "else"]["count"]

# 設定bar的圖型
A = plt.bar(index,         # 索引值代表A肇事原因的長條位置,如index=[0,1,2],分別在3個月的第一個位置
           A,              # 設定長條圖的資料
           bar_width,      # 設定長條寬度
           alpha=.6,       # 設定透明度
           label="drivers")# 設定標籤
B = plt.bar(index+0.2,     # 索引值為A的索引值+0.2(長條寬度),顯示於A長條的旁邊一個長條寬度的位置
            B,
            bar_width,
            alpha=.6,
            label="machine elements")
C = plt.bar(index+0.4,
            C,
            bar_width,
            alpha=.6,
            label="passengers")
D = plt.bar(index+0.6,
            D,
            bar_width,
            alpha=.6,
            label="facility")
E = plt.bar(index+0.8,
            E,
            bar_width,
            alpha=.6,
            label="else")

# 使得每個長條圖上顯示資料標籤,詳見:[https://stackoverflow.com/questions/40489821/how-to-write-text-above-the-bars-on-a-bar-plot-python](http://)
def createLabels(data):                   # 自定義函數,為引用plusone團隊
    for item in data:
        height = item.get_height()
        plt.text(
            item.get_x()+item.get_width()/2.,
            height*1.05,
            '%d' % int(height),
            ha = "center",
            va = "bottom",
        )
createLabels(A)
createLabels(B)
createLabels(C)
createLabels(D)
createLabels(E)

# 定義標籤
plt.ylabel("counts")          # 設定y軸標題
plt.xlabel("time")            # 設定x軸標題
plt.title("Bar chart of car accident(107/12-108/02)", {'fontsize' : 17})  # 設定標題、文字大小
plt.xticks(index+ .3 / 2 ,("107/12", "108/01", "108/02"))  #.xticks為x軸文字(為了置中所以+0.3/2)
plt.ylim(0, 250)                 # 設定y軸範圍
plt.legend(prop = {'size':9})    # 設定圖例及其大小
plt.grid(True)                   # 顯示格線

# 儲存圖檔
plt.savefig("Bar chart of car accident.jpg",   # 儲存圖檔
            bbox_inches='tight',               # 去除座標軸占用的空間
            pad_inches=0.0)                    # 去除所有白邊
plt.close()      # 關閉圖表
4. 大功告成。
可看出這3個月中,肇事原因主要來自駕駛及乘客,且駕駛占絕大多數。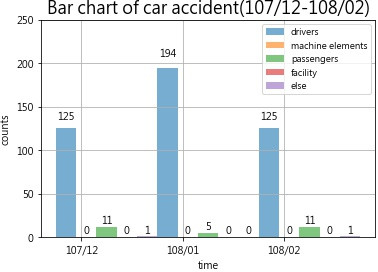
P.S. 本篇程式碼參考plusone團隊-[Day20]Matplotlib資料視覺化進階!,並利用網路實際的開放資料執行
 Eric HSIEH

 iThome鐵人賽