import matplotlib.pyplot as plt
import requests
import bs4
aa="https://rate.bot.com.tw/xrt/quote/l6m/USD"
htmlcontent=requests.get(aa)
htmlcontent.encoding="utf-8"
obj=bs4.BeautifulSoup(htmlcontent.text,"html.parser")
dates=[]
ds1=obj.find_all("td",{"class":"text-center"})
for x in range(len(ds1)):
if x%2==0:
dates.append(ds1[x].text)
us_price=[]
ds2=obj.find_all("td",{"class":"rate-content-sight text-right print_table-cell"})
for x in range(len(ds2)):
if x%2!=0:
us_price.append(float(ds2[x].text))
aa="https://rate.bot.com.tw/xrt/quote/l6m/EUR"
htmlcontent=requests.get(aa)
htmlcontent.encoding="utf-8"
obj=bs4.BeautifulSoup(htmlcontent.text,"html.parser")
eur_price=[]
ds3=obj.find_all("td",{"class":"rate-content-sight text-right print_table-cell"})
for x in range(len(ds3)):
if x%2!=0:
eur_price.append(float(ds3[x].text))
dates.reverse()
us_price.reverse()
eur_price.reverse()
font={"family":"DFKai-SB"}
plt.rc("font",**font)
fig = plt.figure()
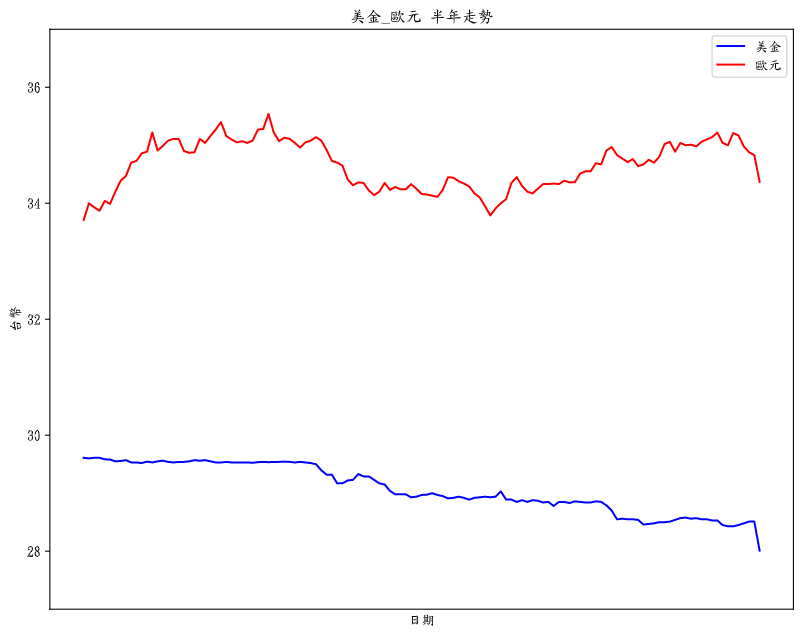
plt.plot(dates,us_price,color="blue",label="美金")
plt.plot(dates,eur_price,color="red",label="歐元")
#plt.xticks(fontsize=6,rotation=90)
plt.xticks([]) # 隱藏標籤
plt.xlabel("日期")
plt.ylabel("台幣")
plt.ylim(27,37)
plt.title("美金_歐元 半年走勢")
plt.legend()
fig.set_figwidth(10)
fig.set_figheight(8)
plt.savefig('c:\\PP\\test.png')
plt.show()
 Max Cheng
