Day 27- ggplot資料視覺化 Part 3(2)- choroplethr
(前言:內個,我只是個剛接觸程式設計的小萌新,如果內文內容、程式碼、統計資料圖寫或畫的不對,還請各位大大指教 Orz)
大家應該都討厭前幾天的cp空氣資料了吧 ˊˇˋ 那我們今天就不畫空氣品質圖了,我們今天改畫地圖面量圖。
在開始學習今天內容之前,先安裝三個套件:choroplethr, choroplethrMaps, 及WDI,choroplethr是一個ggplot2延伸出來的面量圖繪圖套件,choroplethrMaps則是choroplethr的附加套件,WDI是一個含有世界銀行世界發展指標(World Development Indicator)資料的套件,總共有493筆資料,如果要使用其中的資料的話,可以使用WDISearch()函數查詢資料對應代碼。
接下來就可以開始畫圖,首先我們從choroplethr的美國人口分布圖開始畫。Choroplethr有內建美國2012人口資料,名稱為df_pop_state,繪圖程式碼如下:
data("df_pop_state")
state_choropleth(df_pop_state, title = "US population", legend = "Population count")
首先呼叫df_pop_state資料,接下來使用state_choroplete繪製美國的地圖,使用資料為df_pop_state,標題為US population,圖例命名為Population count。
結果如下: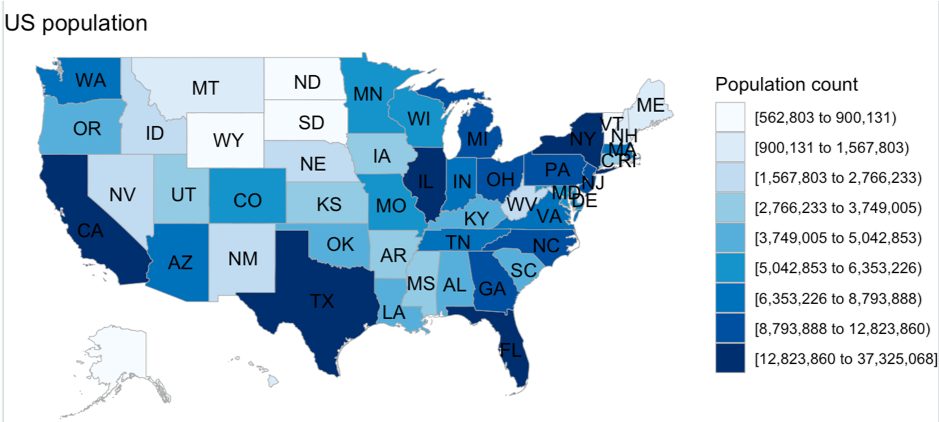
用同樣的方法也可以畫出世界人口分布圖,程式碼如下:
data("df_pop_country")
country_choropleth(df_pop_country, title = "World Population 2012", num_colors = 9, legend = "Population count")
可以看到繪圖方法與繪製美國人口分布圖沒有什麼兩樣,只是函數要換成country_choropleth,另外,我這邊也把num_colors引數改成9,讓人口圖例有9個分組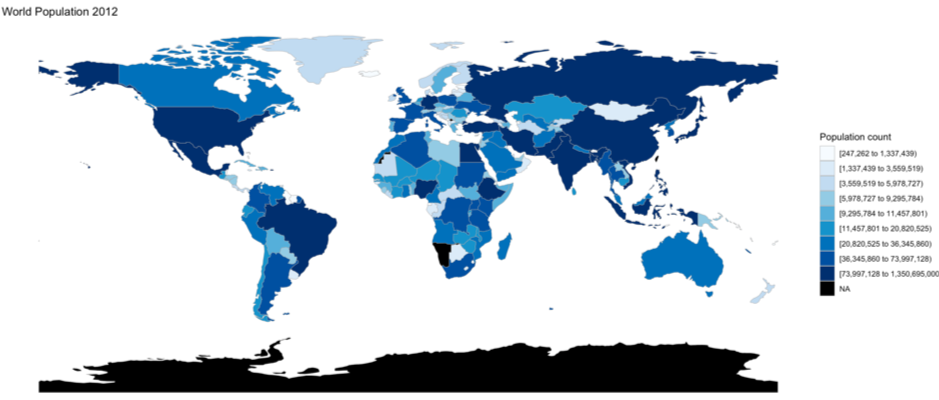
另外,也可以用zoom引數指定區域,假設指定台灣(可是沒有台灣的人口資料QQ)、中國、南北韓、日本的人口資料,程式碼如下:
country_choropleth(df_pop_country,
                   title = "Population by regions 2012",
                   num_colors = 7,
                   legend = "Population count",
                   zoom = c("china", "south korea", "north korea", "japan", "taiwan"))
繪圖結果如下: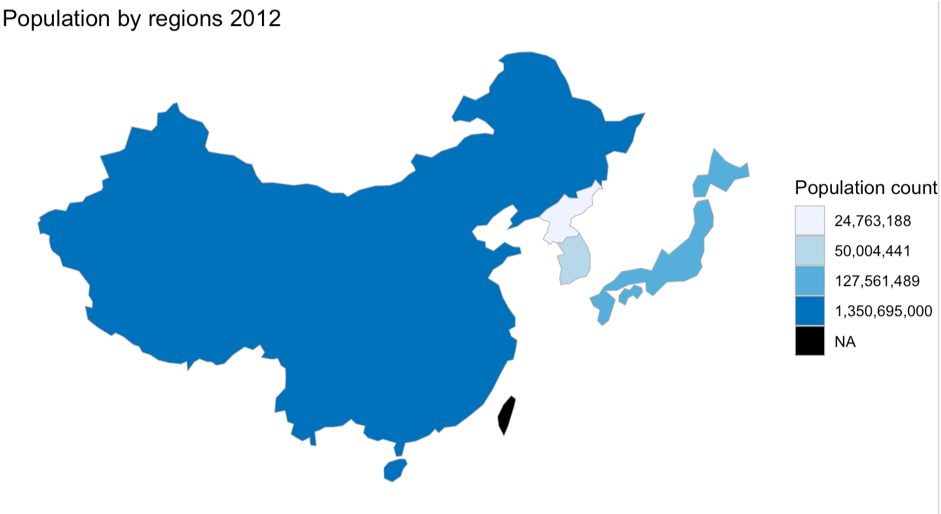
最後來學習WDI與choroplethr結合使用,choroplethr有一個函數choroplethr_wdi專門給WDI資料使用,我們只要輸入資料名稱(對應WDISearch代碼)即可繪圖。以GDP年成長率為例,繪圖程式碼如下:
choroplethr_wdi(code = "NY.GDP.MKTP.KD.ZG", year = 2012, title = "GDP Annual Growth (%)")
code指定資料代碼,year指定年次(大多數資料應該都是2012年),title指定標題,最後繪圖結果如下: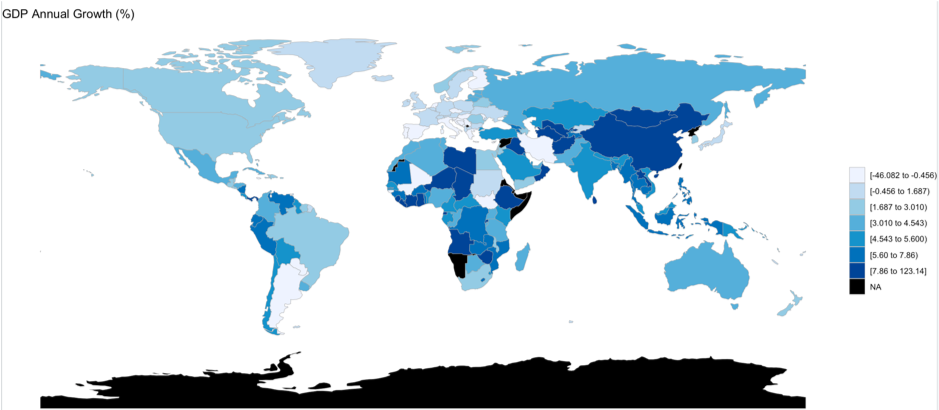
今天就先學到這邊吧 ˊˇˋ
參考資料:


 iThome鐵人賽