1.下載matplotlib:
在terminal輸入指令 pip install matplotlib
2.基本實作:
import pandas as pd
from matplotlib import pyplot as plt #
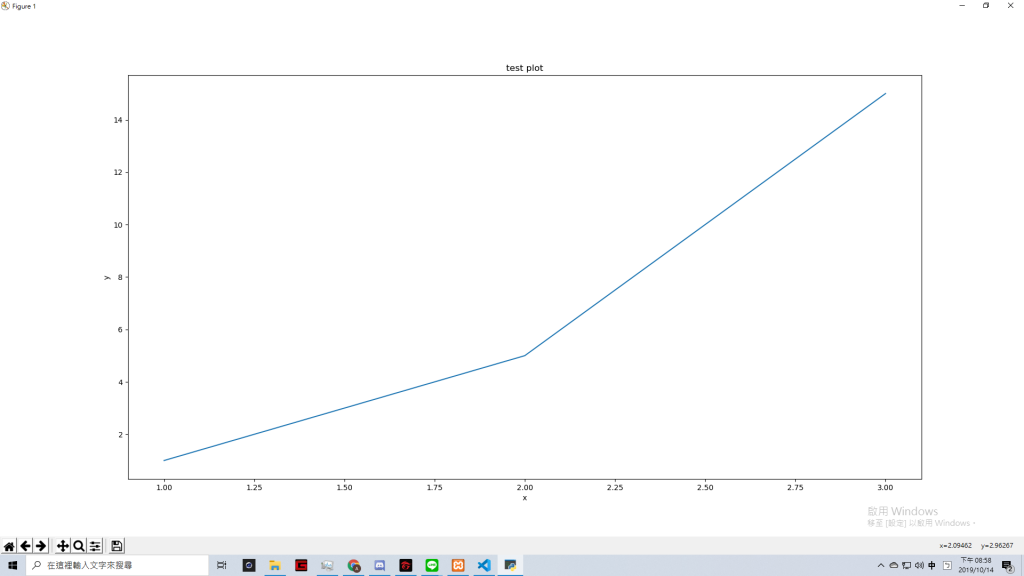
x = [1,2,3] #定義x座標
y = [1,5,15] #定義y座標
plt.plot(x,y) #利用x與y繪製圖表
plt.title("test plot") #定義title
plt.xlabel("x") #定義x座標名稱
plt.ylabel("y") #定義y座標名稱
plt.show() 顯示圖表
執行:
3.多條資料:
在原本的程式增加以下程式碼
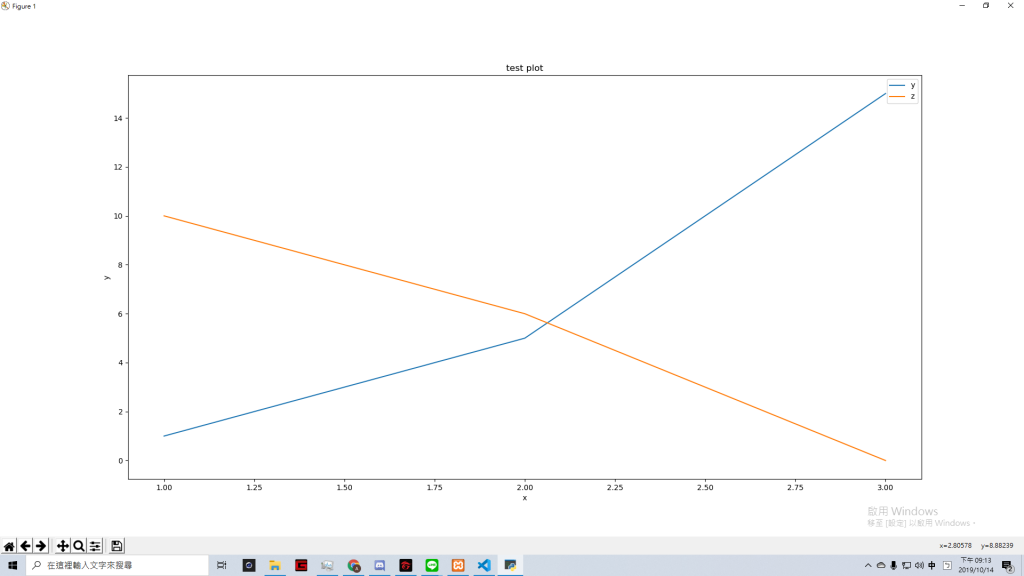
z = [10,6,0] #定義z的數值
plt.plot(x,z) #利用x與z的值建立圖表
plt.legend(["y","z"]) #標示出各自的函數
執行:
4.讀取csv檔案並繪製成圖表:
1.將需要的csv檔案存入專案資料夾
2.印出檔案內容:
import pandas as pd
from matplotlib import pyplot as plt
sample_data = pd.read_csv("sample_data.csv")
print(sample_data)
執行結果:
column_a column_b column_c
0 1 1 10
1 2 4 8
2 3 9 6
3 4 16 4
4 5 25 2
3.利用檔案繪製圖表:
import pandas as pd
from matplotlib import pyplot as plt
sample_data = pd.read_csv("sample_data.csv")
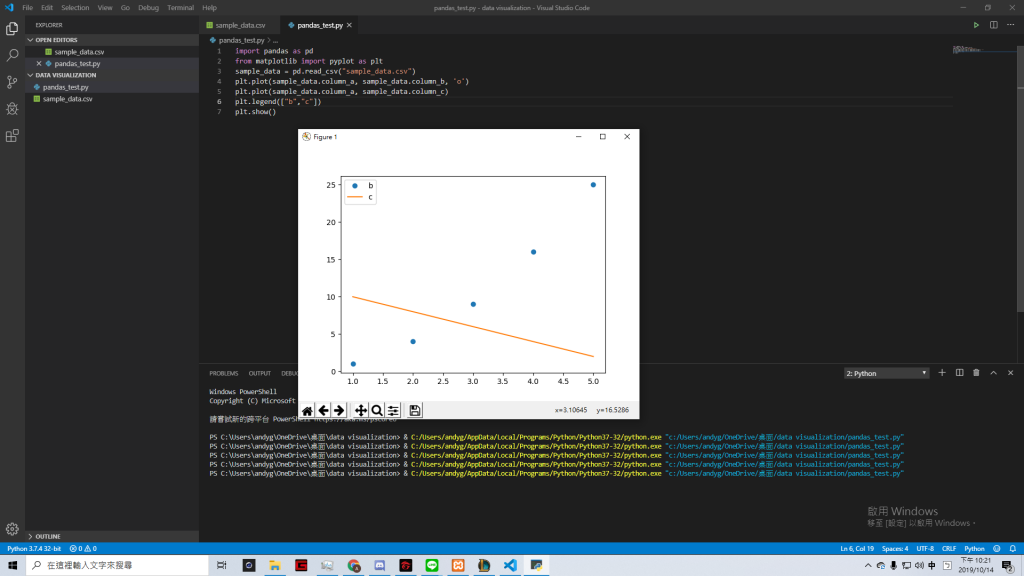
plt.plot(sample_data.column_a, sample_data.column_b, 'o') #將a、b所繪製的圖表更改顯示方式
plt.plot(sample_data.column_a, sample_data.column_c) #利用a、c繪製圖表
plt.legend(["b","c"]) #標示ab、ac的圖示
plt.show() #執行
執行:
