最近EDR(Endpoint Detection and Response) 到處被推廣,OpenSource較有名的像OSSEC、osquery,看到Elastic推出Endpoint Security是類似的解決方案,不過該專案還在測試中,先來玩看看
https://www.elastic.co/blog/introducing-elastic-endpoint-security
依照手冊建立: https://www.elastic.co/guide/en/security/current/install-endpoint.html
第一次使用時先到Kibana -> Ingest Manager > Integrations 搜尋 “Elastic Endpoint Security"點選Add
選擇Default或自己新建一個Configuration群組也可以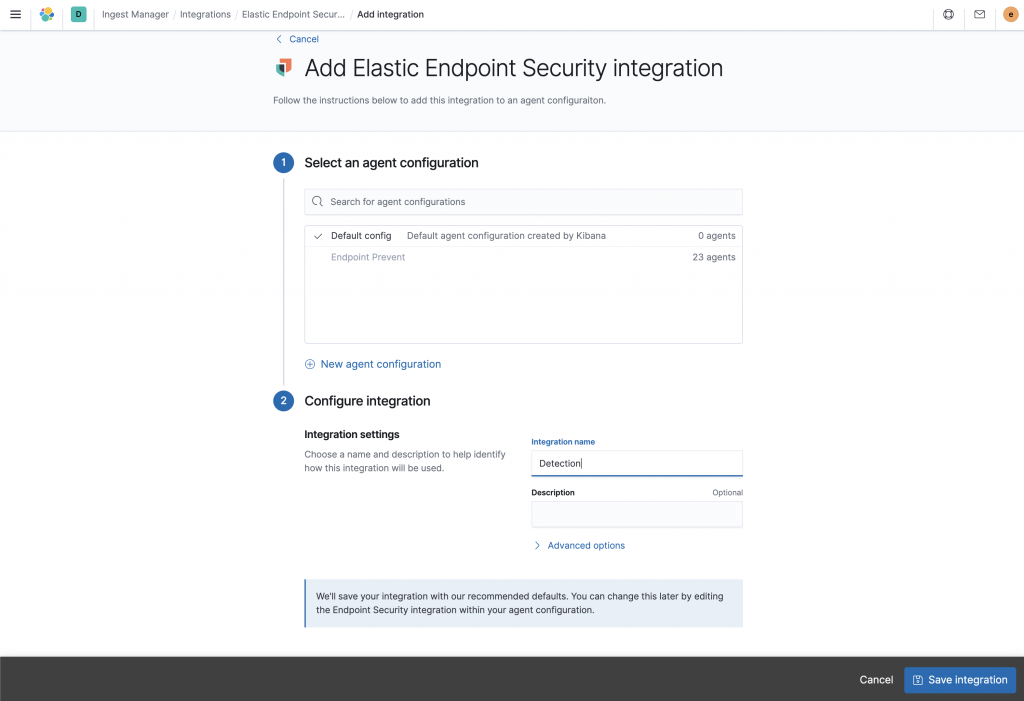
add elastic endpoint security
回到Kibana -> Overview 選Add agent -> Enroll with Fleet (第一次要啟用)地雷: Elastic Cloud在寫這篇文章時是7.9,要下載7.9版的Agent而不是最新版
#錯誤訊息
fail to enroll: fail to execute request to Kibana: Status code: 400, Kibana returned an error: Bad Request, message: Agent version is not compatible with kibana version
選擇剛建立的agent configuration,把指令貼到Powershell執行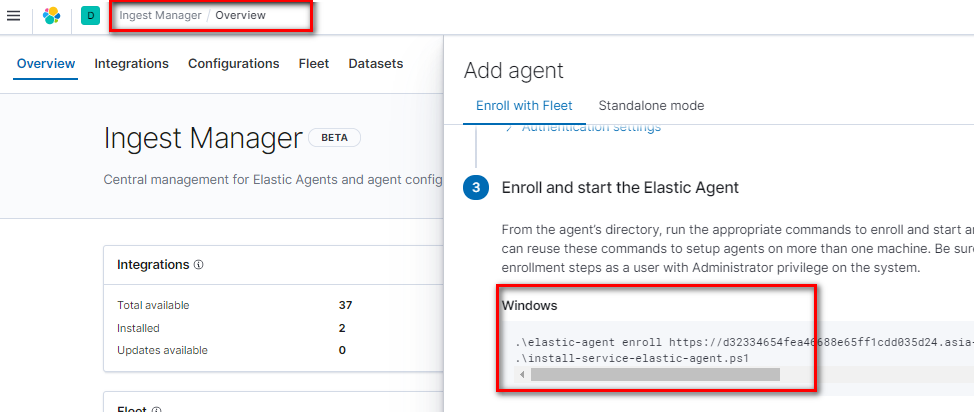
完成後到Fleet會看到該設備已經報到了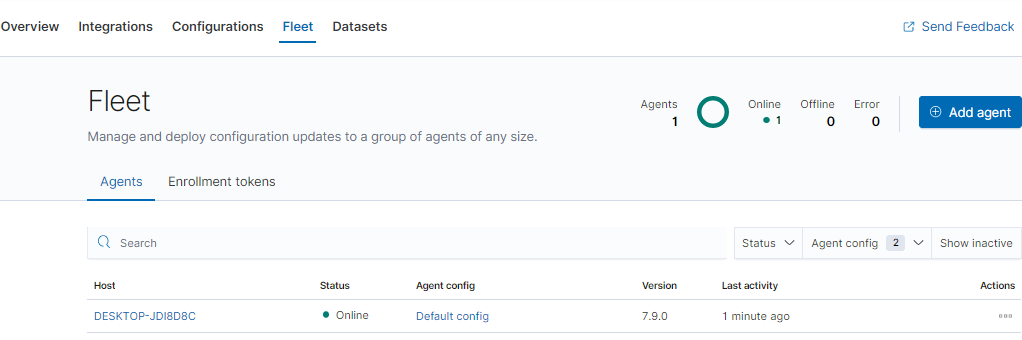
然後就跳錯誤…. (重開機就安裝成功了)
Application: endpoint-security--7.9.0[cbe67232-8639-4e3d-b003-e156da6a5f7b]: State changed to FAILED: operation 'operation-verify' marked 'endpoint-security.7.9.0' corrupted: /go/src/github.com/elastic/beats/x-pack/elastic-agent/pkg/agent/operation/operation_verify.go[77]: unknown error
7.9版新增反惡意軟體
https://www.elastic.co/blog/whats-new-elastic-security-7-9-0-free-endpoint-security
到Dection點Manage detection rules 加載Rule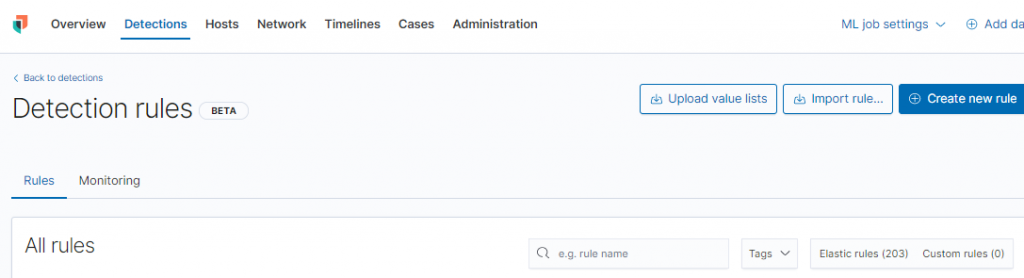
規則在Github可以查看,可以自己編寫規則,可添加ATT&CK的tag
https://github.com/elastic/detection-rules/blob/main/rules/network/initial_access_smb_windows_file_sharing_activity_to_the_internet.toml
以下是initial_access_smb_windows_file_sharing_activity_to_the_internet範例
query = '''
event.category:(network or network_traffic) and network.transport:tcp and (destination.port:(139 or 445) or event.dataset:zeek.smb) and
  source.ip:(10.0.0.0/8 or 172.16.0.0/12 or 192.168.0.0/16) and
  not destination.ip:(10.0.0.0/8 or 127.0.0.0/8 or 172.16.0.0/12 or 192.168.0.0/16 or "::1")
'''


[[rule.threat]]
framework = "MITRE ATT&CK"
[[rule.threat.technique]]
id = "T1190"
name = "Exploit Public-Facing Application"
reference = "https://attack.mitre.org/techniques/T1190/"
可視化的交互過程樹狀圖,當初是因為這功能看起來很炫才研究的,摸了一陣子才找到怎麼開起來…
選擇主機-> Events,點選想看的Event按前面六角形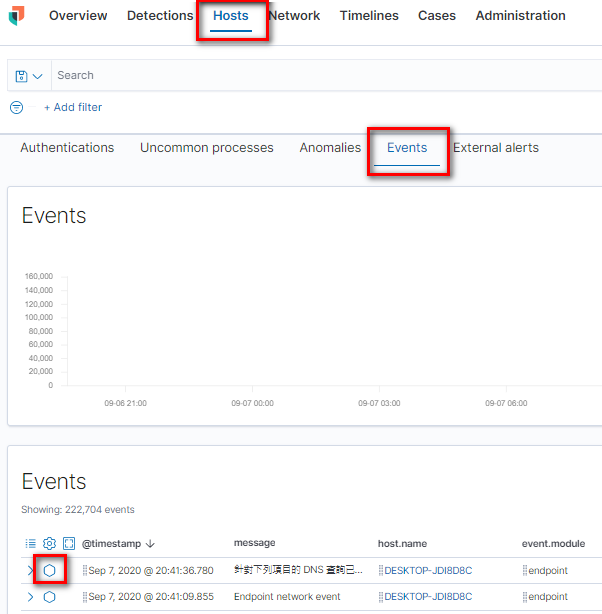
把前幾章裝的Tomcat開起來,查看樹狀圖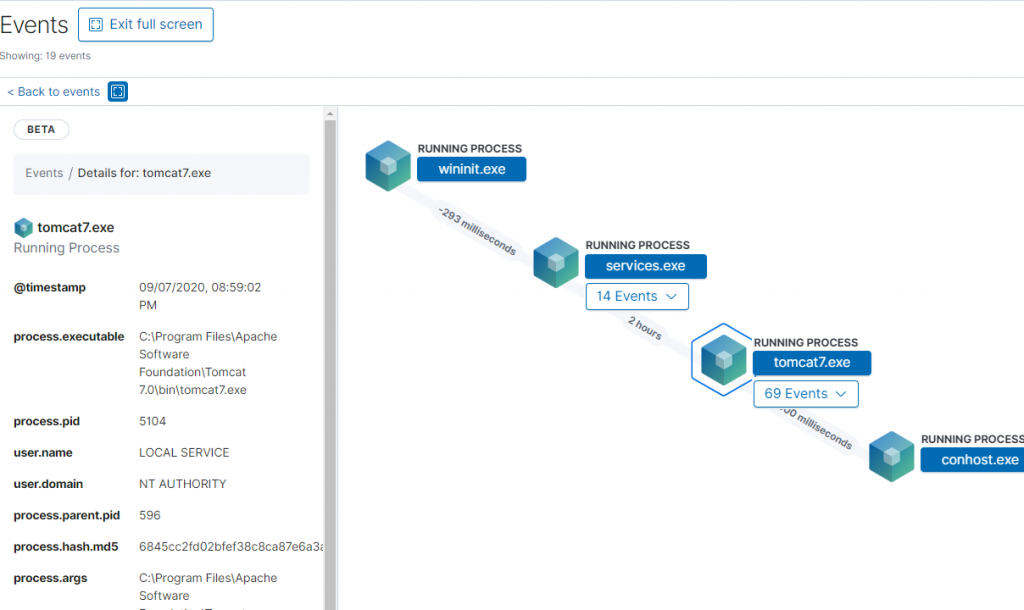
點Tomcat可以看到process.id、執行帳號等資訊,有這些資訊可以方便找出問題主機,及行為特徵


 iThome鐵人賽