前幾章的部分我們都提到部署、測試等等的內容,但我們服務真的上線之後,我們也必須去監控服務的狀態,以免網站都倒了但我們還不知道這件事情!,所以這時候監視就成了一件很重要的事情,這個章節我們就帶大家初步了解Application Insight的用途吧!
準備
Application Insight是Azure的一個監視的服務,他可以監視的內容包括
所以除了本篇會用到的應用程式之外,他還有許多可以監視的部分,可以監視你資源的使用狀況、訂用帳戶的健康狀況...有許多監視的功能可以使用! 也可以將這些資料輸出到Power BI(下一篇會介紹到),通過一個視覺化的報表,馬上就可以知道哪裡出了問題!
首先一樣到Azure Portal,搜尋Application Insights,並且建立,填入一些基本資訊後就可以直接建立了!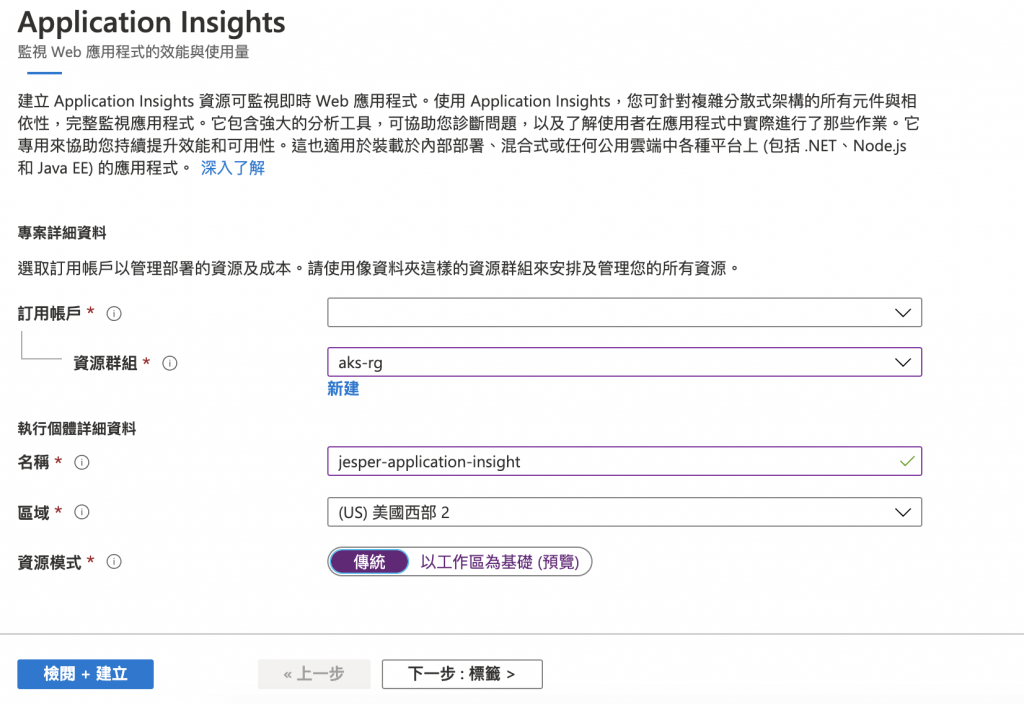
在範例裡的hello_app/templates/home.html修改成,將YOUR_INSTRUMENTATION_KEY_GOES_HERE替換成你的Applictaion Insight裡面的連接字串InstrumentationKey=XXX
<!DOCTYPE html>
<html>
<head>
<title>Azure Monitor Application Insights</title>
<script type="text/javascript">
    !function(T,l,y){var S=T.location,u="script",k="instrumentationKey",D="ingestionendpoint",C="disableExceptionTracking",E="ai.device.",I="toLowerCase",b="crossOrigin",w="POST",e="appInsightsSDK",t=y.name||"appInsights";(y.name||T[e])&&(T[e]=t);var n=T[t]||function(d){var g=!1,f=!1,m={initialize:!0,queue:[],sv:"4",version:2,config:d};function v(e,t){var n={},a="Browser";return n[E+"id"]=a[I](),n[E+"type"]=a,n["ai.operation.name"]=S&&S.pathname||"_unknown_",n["ai.internal.sdkVersion"]="javascript:snippet_"+(m.sv||m.version),{time:function(){var e=new Date;function t(e){var t=""+e;return 1===t.length&&(t="0"+t),t}return e.getUTCFullYear()+"-"+t(1+e.getUTCMonth())+"-"+t(e.getUTCDate())+"T"+t(e.getUTCHours())+":"+t(e.getUTCMinutes())+":"+t(e.getUTCSeconds())+"."+((e.getUTCMilliseconds()/1e3).toFixed(3)+"").slice(2,5)+"Z"}(),iKey:e,name:"Microsoft.ApplicationInsights."+e.replace(/-/g,"")+"."+t,sampleRate:100,tags:n,data:{baseData:{ver:2}}}}var h=d.url||y.src;if(h){function a(e){var t,n,a,i,r,o,s,c,p,l,u;g=!0,m.queue=[],f||(f=!0,t=h,s=function(){var e={},t=d.connectionString;if(t)for(var n=t.split(";"),a=0;a<n.length;a++){var i=n[a].split("=");2===i.length&&(e[i[0][I]()]=i[1])}if(!e[D]){var r=e.endpointsuffix,o=r?e.location:null;e[D]="https://"+(o?o+".":"")+"dc."+(r||"services.visualstudio.com")}return e}(),c=s[k]||d[k]||"",p=s[D],l=p?p+"/v2/track":config.endpointUrl,(u=[]).push((n="SDK LOAD Failure: Failed to load Application Insights SDK script (See stack for details)",a=t,i=l,(o=(r=v(c,"Exception")).data).baseType="ExceptionData",o.baseData.exceptions=[{typeName:"SDKLoadFailed",message:n.replace(/\./g,"-"),hasFullStack:!1,stack:n+"\nSnippet failed to load ["+a+"] -- Telemetry is disabled\nHelp Link: https://go.microsoft.com/fwlink/?linkid=2128109\nHost: "+(S&&S.pathname||"_unknown_")+"\nEndpoint: "+i,parsedStack:[]}],r)),u.push(function(e,t,n,a){var i=v(c,"Message"),r=i.data;r.baseType="MessageData";var o=r.baseData;return o.message='AI (Internal): 99 message:"'+("SDK LOAD Failure: Failed to load Application Insights SDK script (See stack for details) ("+n+")").replace(/\"/g,"")+'"',o.properties={endpoint:a},i}(0,0,t,l)),function(e,t){if(JSON){var n=T.fetch;if(n&&!y.useXhr)n(t,{method:w,body:JSON.stringify(e),mode:"cors"});else if(XMLHttpRequest){var a=new XMLHttpRequest;a.open(w,t),a.setRequestHeader("Content-type","application/json"),a.send(JSON.stringify(e))}}}(u,l))}function i(e,t){f||setTimeout(function(){!t&&m.core||a()},500)}var e=function(){var n=l.createElement(u);n.src=h;var e=y[b];return!e&&""!==e||"undefined"==n[b]||(n[b]=e),n.onload=i,n.onerror=a,n.onreadystatechange=function(e,t){"loaded"!==n.readyState&&"complete"!==n.readyState||i(0,t)},n}();y.ld<0?l.getElementsByTagName("head")[0].appendChild(e):setTimeout(function(){l.getElementsByTagName(u)[0].parentNode.appendChild(e)},y.ld||0)}try{m.cookie=l.cookie}catch(p){}function t(e){for(;e.length;)!function(t){m[t]=function(){var e=arguments;g||m.queue.push(function(){m[t].apply(m,e)})}}(e.pop())}var n="track",r="TrackPage",o="TrackEvent";t([n+"Event",n+"PageView",n+"Exception",n+"Trace",n+"DependencyData",n+"Metric",n+"PageViewPerformance","start"+r,"stop"+r,"start"+o,"stop"+o,"addTelemetryInitializer","setAuthenticatedUserContext","clearAuthenticatedUserContext","flush"]),m.SeverityLevel={Verbose:0,Information:1,Warning:2,Error:3,Critical:4};var s=(d.extensionConfig||{}).ApplicationInsightsAnalytics||{};if(!0!==d[C]&&!0!==s[C]){method="onerror",t(["_"+method]);var c=T[method];T[method]=function(e,t,n,a,i){var r=c&&c(e,t,n,a,i);return!0!==r&&m["_"+method]({message:e,url:t,lineNumber:n,columnNumber:a,error:i}),r},d.autoExceptionInstrumented=!0}return m}(y.cfg);(T[t]=n).queue&&0===n.queue.length&&n.trackPageView({})}(window,document,{
    src: "https://az416426.vo.msecnd.net/scripts/b/ai.2.min.js", // The SDK URL Source
    //name: "appInsights", // Global SDK Instance name defaults to "appInsights" when not supplied
    //ld: 0, // Defines the load delay (in ms) before attempting to load the sdk. -1 = block page load and add to head. (default) = 0ms load after timeout,
    //useXhr: 1, // Use XHR instead of fetch to report failures (if available),
    //crossOrigin: "anonymous", // When supplied this will add the provided value as the cross origin attribute on the script tag
    cfg: { // Application Insights Configuration
        instrumentationKey: "YOUR_INSTRUMENTATION_KEY_GOES_HERE"
        /* ...Other Configuration Options... */
    }});
    </script>
</head>
<body>
    {% extends "layout.html" %}
    {% block title %}
    Home
    {% endblock %}
    {% block content %}
    <p>Hi,I'm Jesper</p>
    {% endblock %}
</body>
</html>
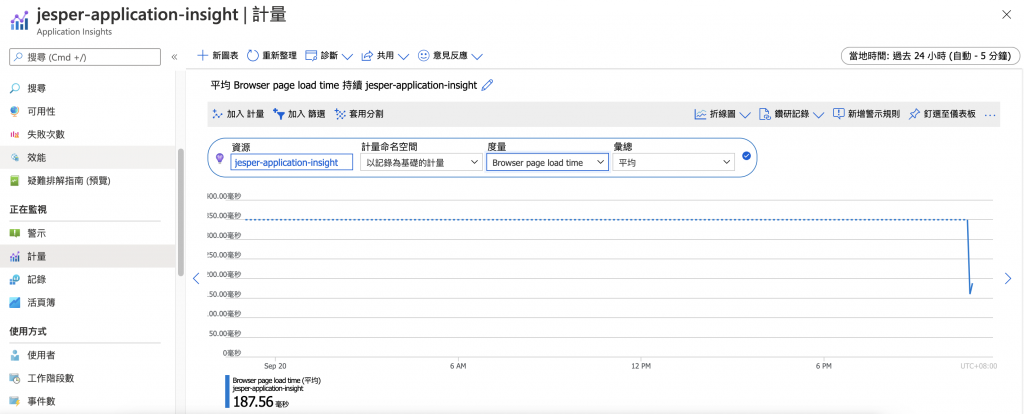
接下來我們把Application Insight的畫面重新整理一下,然後到側邊欄->計量的地方,將度量改成Browser Page Load Time就可以看到瀏覽器平均載入頁面的時間,也有其他的選項可以選擇
也可以透過活頁簿的方式去找到適合自己的範本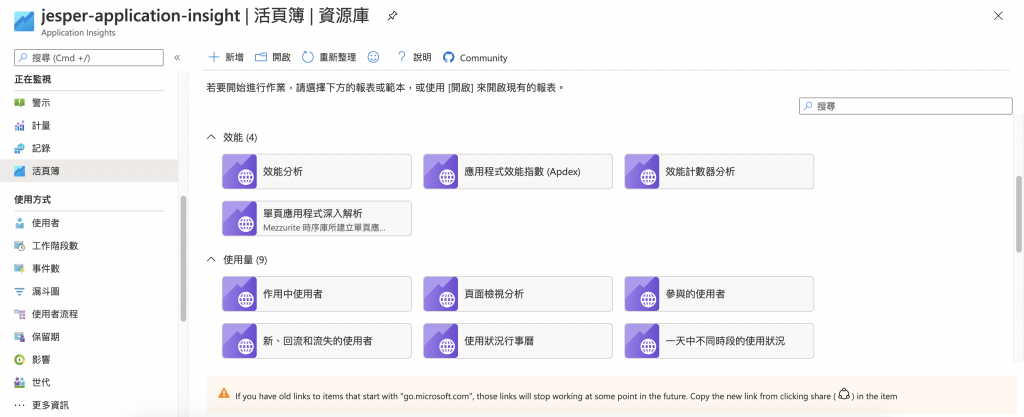
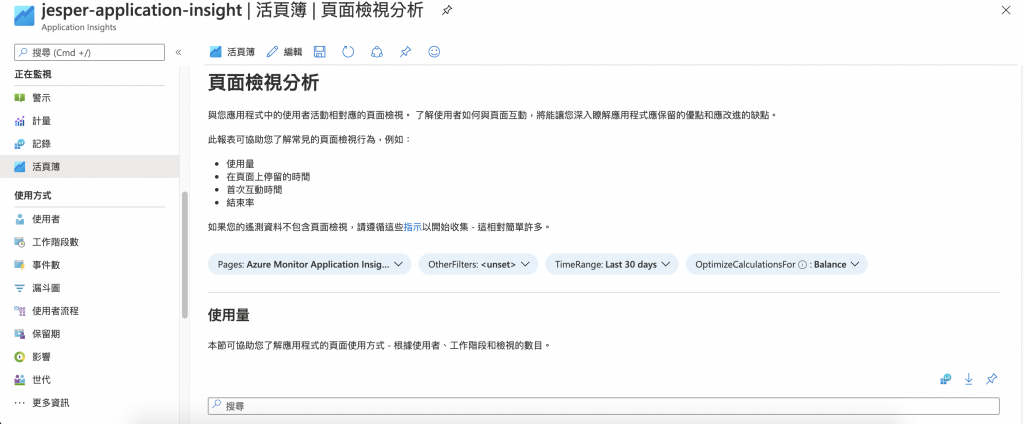
比如說有頁面檢視分析的範本,我們就可以透過這個範本監視
當然監視固然重要,那我們監視到危險的時候就要使用警示的功能,才可以迅速的通知到維運人員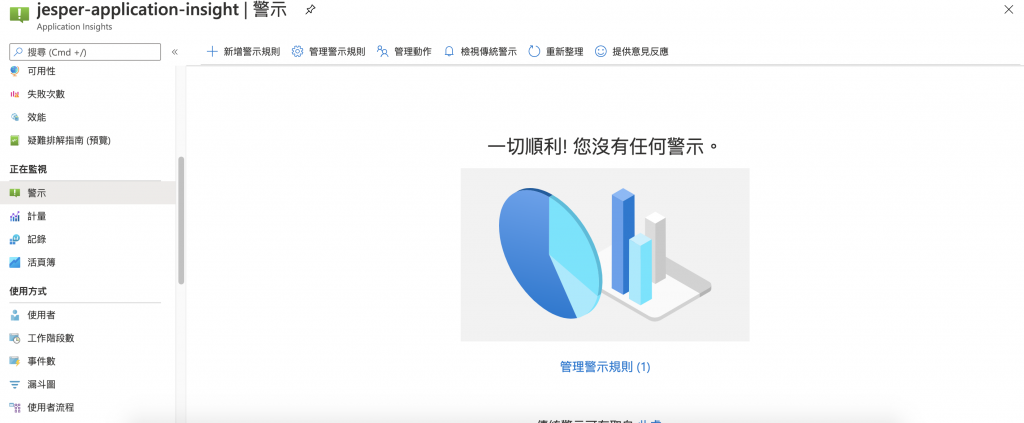
我們可以新增一個警示,然後新增一個條件當Average browser page load time > 10000毫秒的時候觸發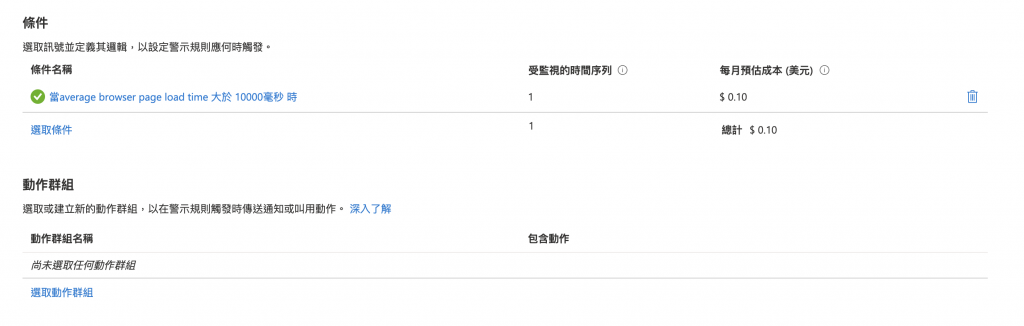
然後新增一個動作群組 -> 建立動作群組 -> 新增一個通知到電子信箱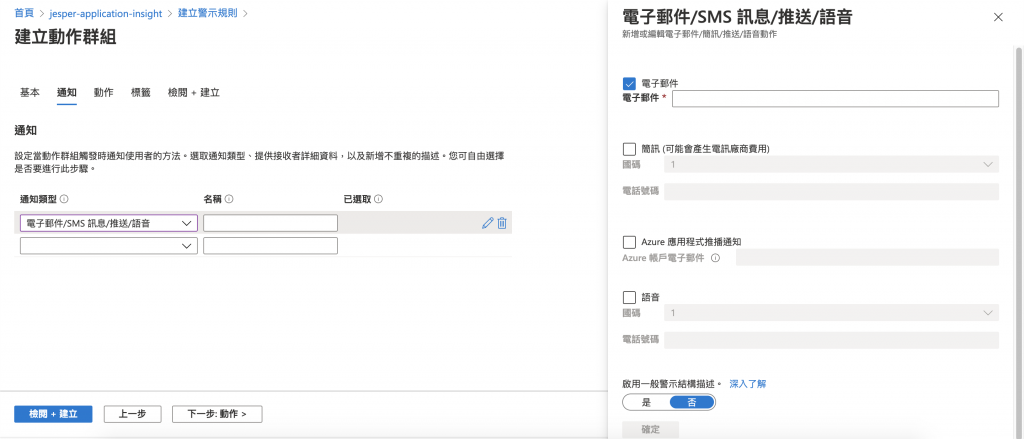
動作我這邊先不填,但未來可以依照服務的現況採取不同的動作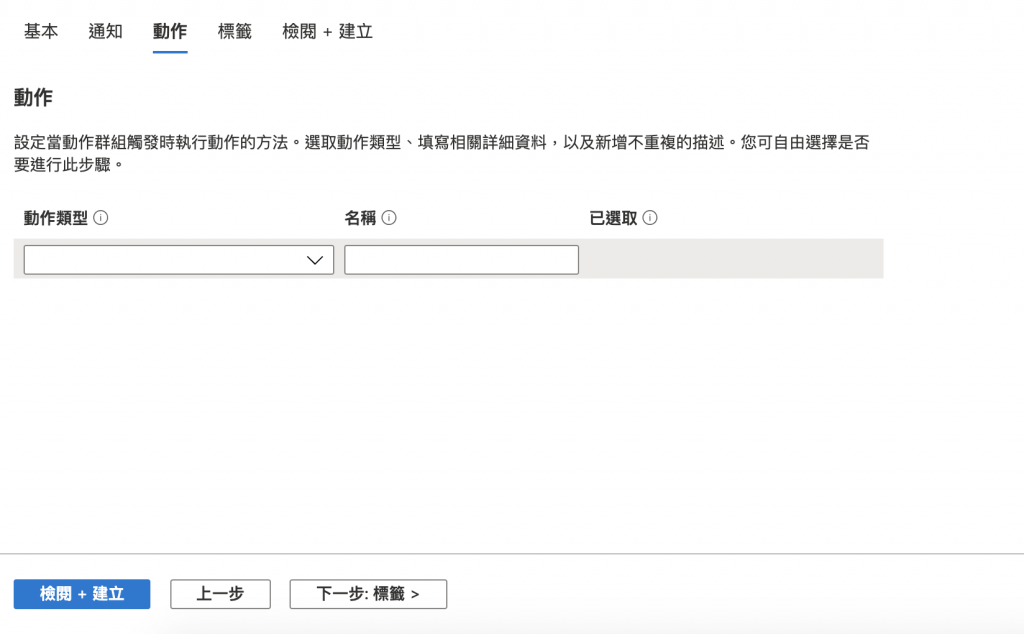
接著再填一些剩餘的資訊就可以按下建立了!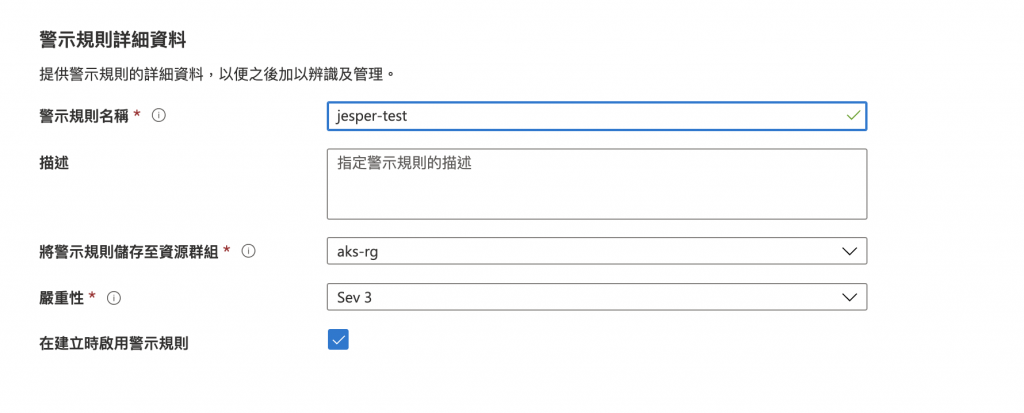
再來Average browser page load time只要大於10000毫秒就會寄信到你的信箱了!! 當然還可以設置一些其他的警示條件、通知的人、做的動作,對ops來說是個很好用的功能!
但上面的狀態都屬於瀏覽器的監視,明天的章節會再繼續跟大家介紹Python後端的部分~~


 iThome鐵人賽