經過這幾個禮拜跟tensorflow的相處,通常用tf建立的模型都很複雜,若要對模型進行觀察並找到錯誤讓他最佳化,我覺得都有一定的難度,而TensorBoard
是一個專門用來呈現TF模型與資料的視覺工具,也支援了好幾種的資料呈現方式,讓使用者更容易掌握複雜的資料。
Tensorboard的架構如下圖所示,其實就是利用產生的logs,使用tf.summary的API將您所定義的tag下的資料放到分類的Dashboard下(Ex: scalars, image 等等)。接下來在用tf.summary的方法來呈現資料,或者將資料寫到目標folder,最後呈現在Tensorboard上。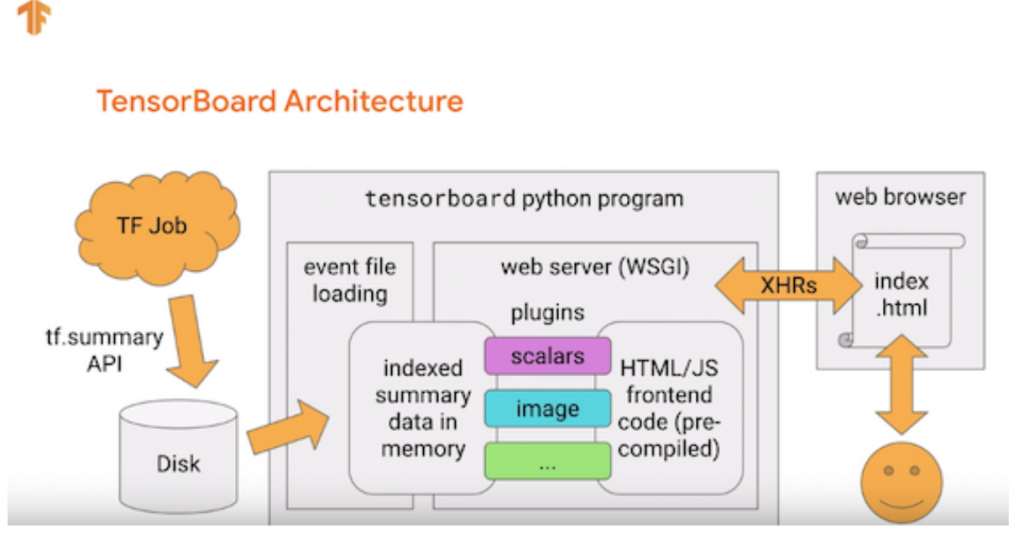
def create_model():
  return tf.keras.models.Sequential([
    tf.keras.layers.Flatten(input_shape=(28, 28)),
    tf.keras.layers.Dense(512, activation='relu'),
    tf.keras.layers.Dropout(0.2),
    tf.keras.layers.Dense(10, activation='softmax')
  ])


def train_model():
  model = create_model()
  model.compile(optimizer='adam',
                loss='categorical_crossentropy',
                metrics=['accuracy'])
  logdir = os.path.join("logs", datetime.datetime.now().strftime("%Y%m%d-%H%M%S"))
  tensorboard_callback = tf.keras.callbacks.TensorBoard(logdir, histogram_freq=1)
  model.fit(x=x_train,
            y=y_train,
            epochs=5,
            validation_data=(x_test, y_test),
            callbacks=[tensorboard_callback])

train_model()

%tensorboard --logdir logs
Tensorboard還有很多功能,例如:dashboard、tag這都比較進階


 iThome鐵人賽