大家好,今天會是有關房價預測模型的最後一天,昨天進行模型的建立,設定優化器、損失函數、指標函數、回調函數,並且完成模型的訓練。接著今天就要觀察模型的訓練結果。
觀察訓練結果時會使用matplotlib.pyplot的方法繪製折線圖,來幫助我們觀察損失函數與指標函數計算出的結果。
首先要匯入套件:import matplotlib.pyplot as plt
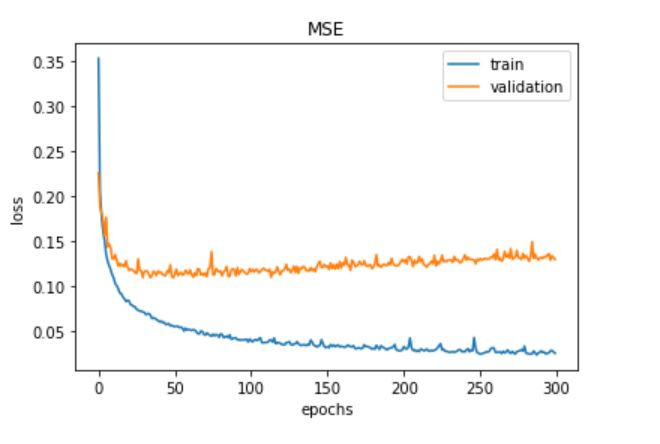
第一個要繪製的是損失函數計算出來的損失值,計算的方法是均方誤差,x軸表示訓練第幾次,y軸表示損失值,藍線代表訓練資料,橘線代表驗證資料。
plt.plot(history.history['loss'], label='train')
plt.plot(history.history['val_loss'], label='validation')
plt.title('MSE')
plt.ylabel('loss')
plt.xlabel('epochs')
plt.legend(loc='best')
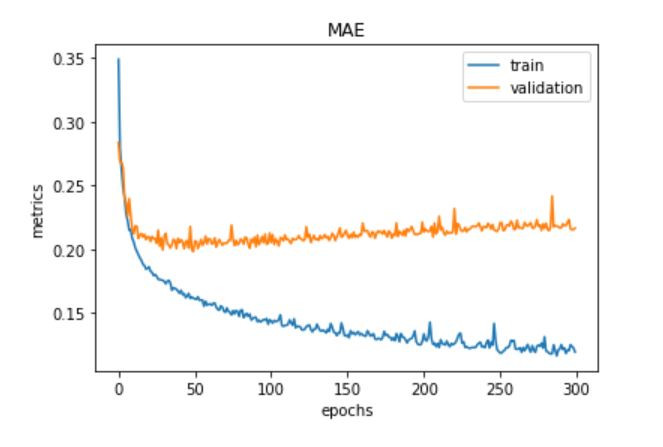
再來是繪製指標函數計算出的效能指標,計算的方法是平均絕對誤差,x軸表示訓練第幾次,y軸表示效能指標,藍線代表訓練資料,橘線代表驗證資料。
plt.plot(history.history['mean_absolute_error'], label='train')
plt.plot(history.history['val_mean_absolute_error'], label='validation')
plt.title('MAE')
plt.ylabel('metrics')
plt.xlabel('epochs')
plt.legend(loc='best')
最後則是用測試資料的預測房價來與答案計算誤差率。
model = keras.models.load_model('lab2-logs/models/Best-model-1.h5')
y_test = np.array(test_data['price'])
test_data = (test_data - mean) / std
x_test = np.array(test_data.drop('price', axis='columns'))
y_pred = model.predict(x_test)
y_pred = np.reshape(y_pred * std['price'] + mean['price'], y_test.shape)
percentage_error = np.mean(np.abs(y_test - y_pred)) / np.mean(y_test) * 100
print("Model Percentage Error: {:.2f}%".format(percentage_error))
顯示的結果為:Model Percentage Error: 13.46%


 iThome鐵人賽