上回提到視覺化特徵圖,這是一個可以用來解釋模型學到了什麼的方法,今天介紹另一種技術:損失視覺化(Loss Visualization)。
我們考慮一個神經網路 $f_\theta$ 以及對應的損失函數 $\lambda (f_\theta(x), y)$,隨機給定一個初始值 $\theta,\ \theta_1,\ \theta_2$,如果是二維視覺話的話,考慮 $\theta(\alpha) = \theta + \alpha (\theta - \theta_1)$,若是三維視覺化,則考慮 $\theta(\alpha, \beta) = \theta + \alpha (\theta_1 - \theta) + \beta (\theta_2 - \theta)$,則把 $\lambda(f_{\theta(\alpha)}(x), y)$ 或 $\lambda(f_{\theta(\alpha, \beta)}(x), y)$ 對於 $(\alpha, \beta) \in [0, 1] \times [0, 1]$ 給畫出來,則如下圖。
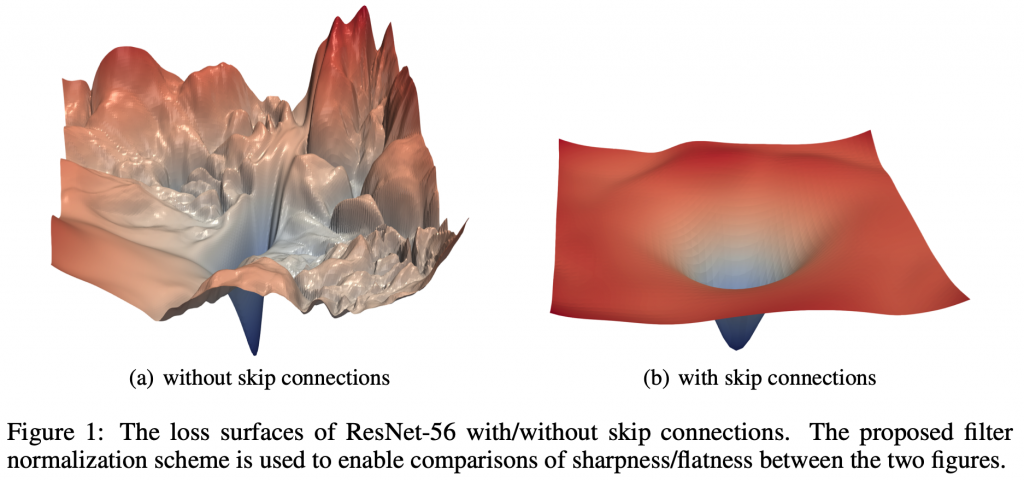
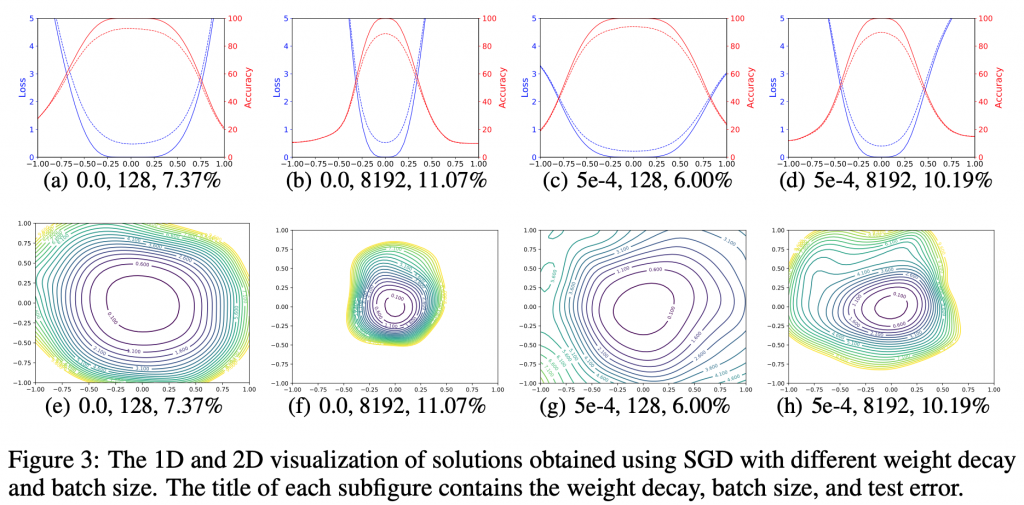
(圖片取自:[1])
[1]:Li, H., Xu, Z., Taylor, G., Studer, C., & Goldstein, T. (2018). Visualizing the loss landscape of neural nets. In Advances in Neural Information Processing Systems (pp. 6389-6399).


 iThome鐵人賽