今天教學Numpy & Pandas & Matplotlib
import pandas as pd
number = pd.Series([11, 12, 30, 15, 22, 17])
name = pd.Series(['John', 'Mary', 'Amy' , 'Paul'])
tel = pd.Series(['04-22851549', '04-22851410', '04-22850266'])

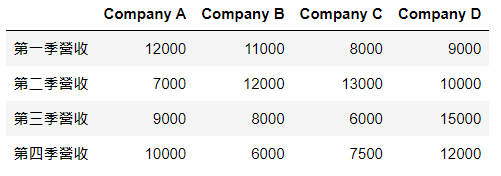
df = pd.DataFrame([[12000, 11000, 8000, 9000],[7000,12000,13000,10000],[9000,8000,6000,15000],[10000,6000,7500,12000]],columns = ['Company A', 'Company B', 'Company C', 'Company D'], index=['第一季營收', '第二季營收', '第三季營收', '第四季營收'])
df

# 將DataFrame儲存成csv檔
df.to_csv('test.csv')

# 載入csv檔
test = pd.read_csv('test.csv')
test
# 將資料畫成圖
import matplotlib.pyplot as plt
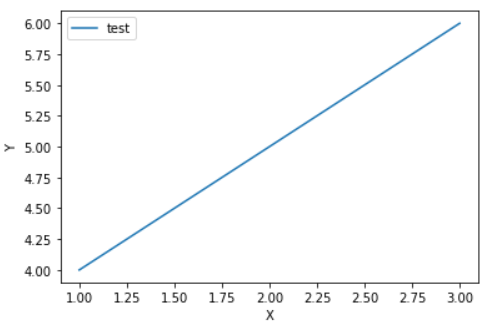
x = [1, 2, 3]
y = [4, 5, 6]
fig, axes = plt.subplots()
axes.set_xlabel('X')
axes.set_ylabel('Y')
axes.plot(x, y, label = 'test')
axes.legend(loc='upper left')

plt.show()

