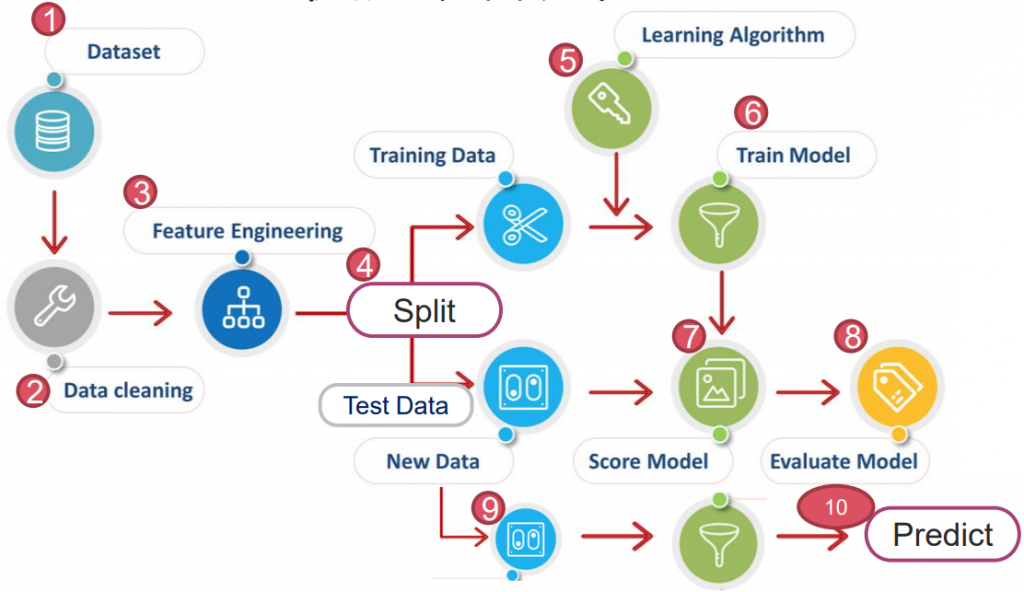
https://yourfreetemplates.com/free-machine-learning-diagram/
Exploratory Data Analysis 又稱 EDA。
為瞭解資料的主要特性,會將蒐集而來的資料作分析,且常採用視覺化來進行判斷。
狹義來說,EDA 即資料收集/資料處理/視覺化...等過程。廣義來說,EDA 還包含 Data Clean。
基本資料的匯入、找尋。純粹做練習用的資料如下:
常包含以下幾個步驟:
常用的指令有幾種,包含 matplotlib(*補充看我、或我)、pandas 中的 plot 以及 seaborn(*補充看我)...等。
以下會以"tips"資料集來介紹 seaborn 的幾種圖:
# 載入必要套件 & 'tips' 資料集
import numpy as np
import pandas as pd
import matplotlib.pyplot as plt
import seaborn as sns
tips = sns.load_dataset('tips')
# 通常偏移分配,會多取 log 矯正
sns.distplot(np.log(tips['tip']), bins=20) # , kde=False
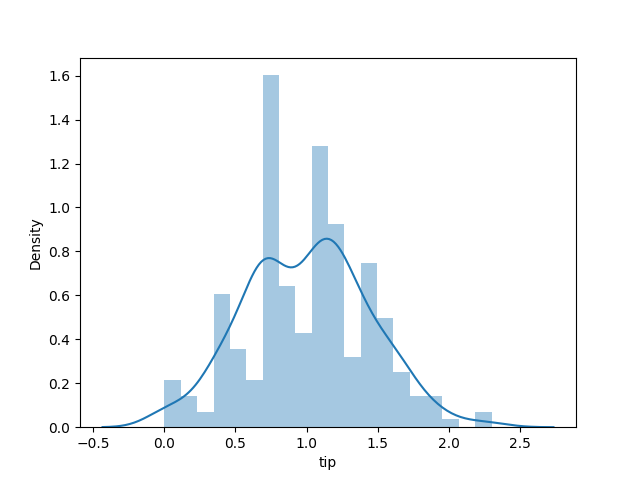
# hue= : 可以依照選擇 item 以顏色區分
sns.relplot(x='total_bill', y='tip', data=tips, hue='smoker')
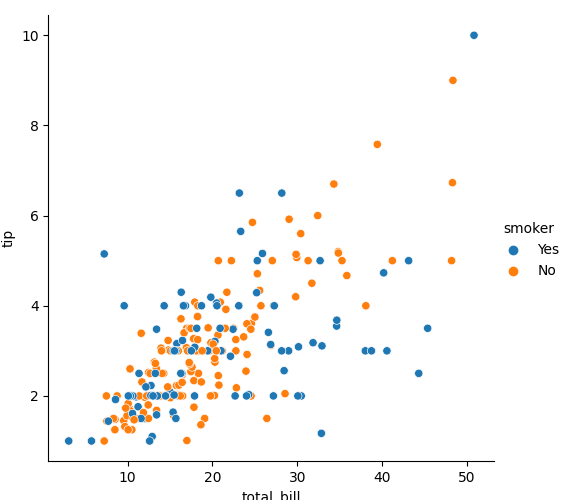
sns.boxplot(x='day', y='tip', data=tips, hue='sex')
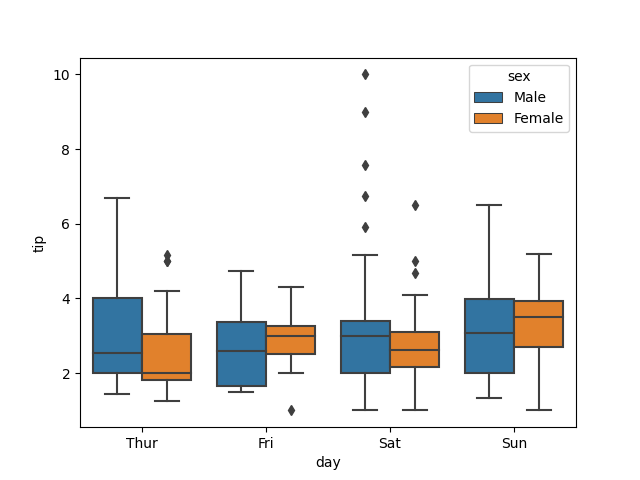
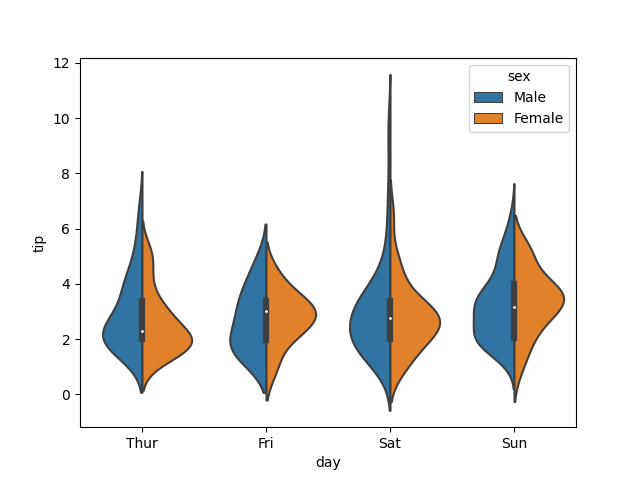
# split=True:可將 hue 的內容分布在兩側
sns.violinplot(x='day', y='tip', data=tips, hue='sex', split=True)
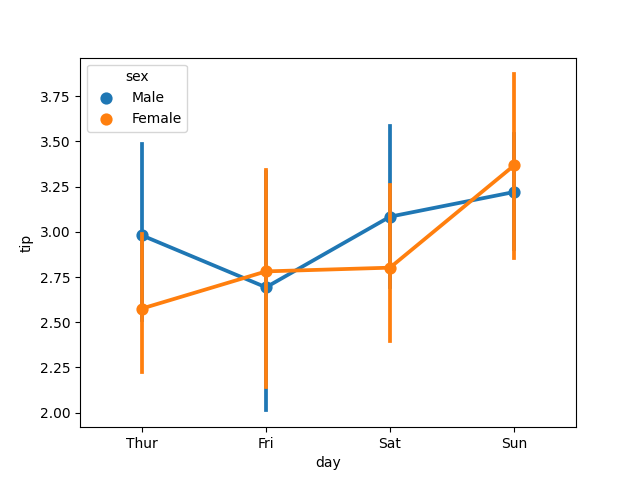
sns.pointplot(x='day', y='tip', data=tips, hue='sex')
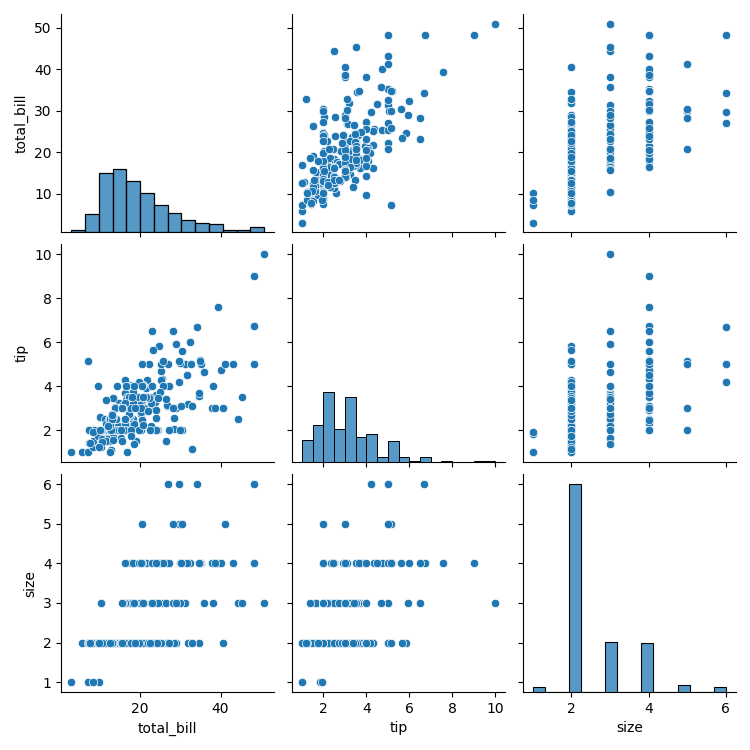
sns.pairplot(tips)
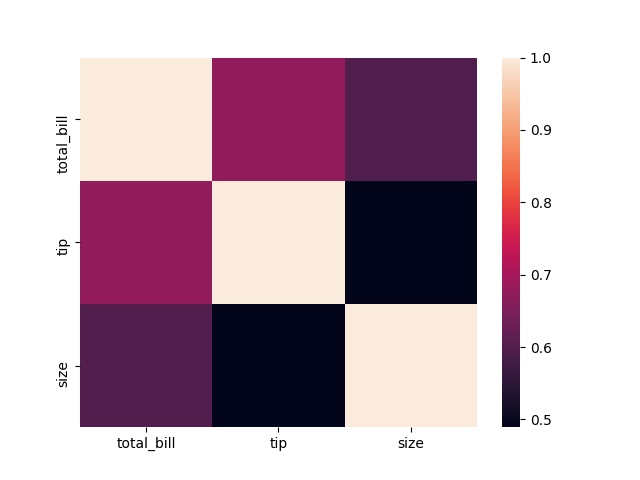
sns.heatmap(tips.corr())
import pandas as pd
import seaborn as sns

df = sns.load_dataset('titanic')
df.head(10)

查看資料類型
df.info()
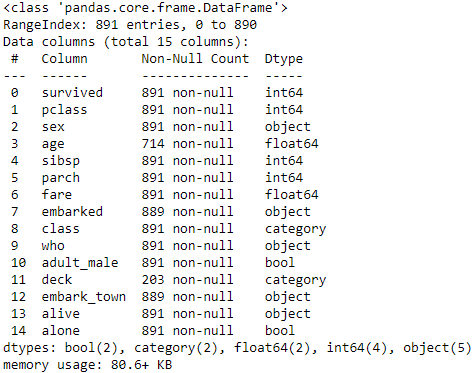
查看描述統計量
df.describe(include='all')
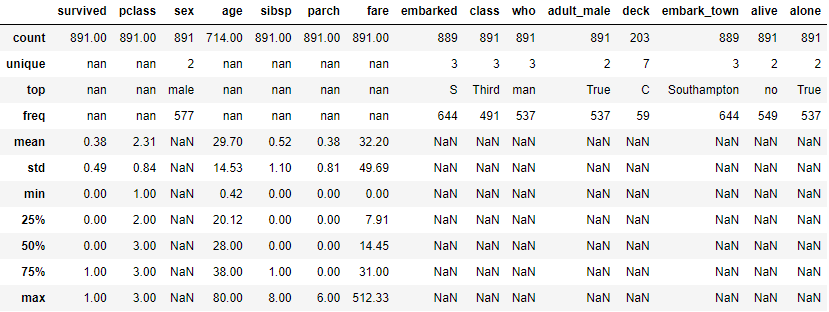
df['survived'].nunique()
>>  2

df['survived'].unique()
>>  array([0, 1], dtype=int64)

df['survived'].value_counts()
>>  0    549
    1    342
    Name: survived, dtype: int64
# initial data
df.head()

# check NaN value
df.isna().sum()
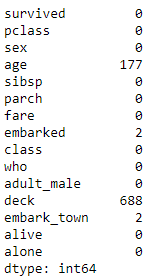
可以發現有許多重複/缺失項目,下面一項一項來處理:
A. 刪去重複項目
df.drop(['who', 'deck', 'embark_town','adult_male', 'deck', 'class', 'alive', 'alone'],
    axis=1, inplace=True)
df.head()
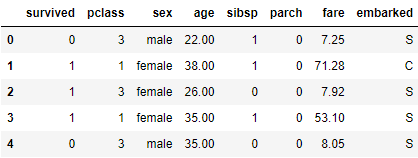
B. 填補缺失項目
B-1. 填補 age
df[df['age'].isna()]
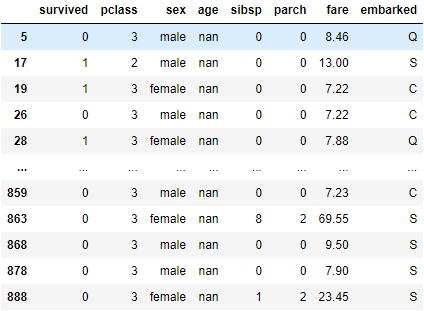
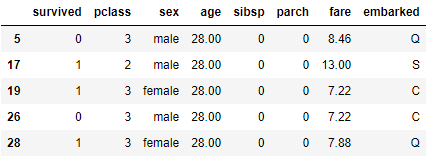
# 使用中位數來填補
df['age'].fillna(df['age'].median(), inplace=True)
df.iloc[[5, 17, 19, 26, 28]]   # 挑其中幾個檢查
B-2. 填補 embarked
df[df['embarked'].isna()]

# 以前面一個的值填補
df['embarked'].fillna(method='ffill', inplace=True) # 或者 method='bfill'
df.iloc[[60, 61, 828, 829]]

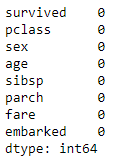
*Double check
df.isna().sum()
有序 ordinal: 特徵值隱含順序及大小高低之分 如: 'class' 'age' 等
名目 nominal: 不含順序大小 如: 'sex' 'embarked'
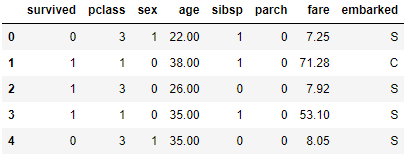
A. 將 'sex' 轉換為 0/1
df.sex.unique()
>>  array(['male', 'female'], dtype=object)
df.sex = df.sex.map({'male':1, 'female':0})
df.head()
B. 將 'embarked' 轉換
# 確認登船港口 vs. 生存率
sns.barplot(data=df, x='embarked', y='survived')
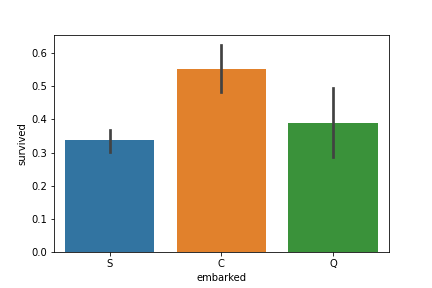
根據史料,登船港口依序為 Southampton -> Cherbourg -> Queenstown
此結果顯示登船港口與生存率無顯著相關,並沒有因為早上船而容易死亡。
故將其轉換為 one-hot encoding,避免影響判斷。
df.embarked.unique()
>>  array(['S', 'C', 'Q'], dtype=object)

# Transfer
df = pd.get_dummies(df, columns=['embarked'])
df.head()

C. 將年齡轉換為級距
因考慮各個年齡層生存機率應相近,故使用 pd.cut() 將 'age' 切成幾個級距。
首先觀察各個級距存活率:
bins=[0, 12, 22, 30, 50, 60, 100]
age_cut = pd.cut(df['age'], bins)

sns.barplot(x=age_cut, y=df['survived'])
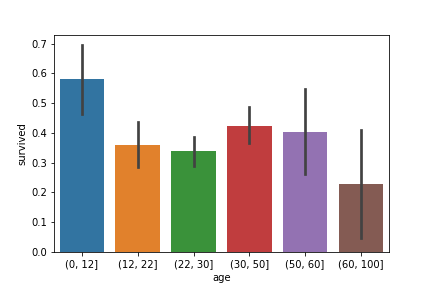
依據上圖,將各個年齡層進行有序 (ordinal) 編碼。生存機率最高為 5;最低為 0。
df['age'] = pd.cut(df['age'], bins, labels=[5, 2, 1, 4, 3, 0])
df.head()

D. 歸一化 'fare'
找出票價為 0 者:
df[df['fare'] == 0]
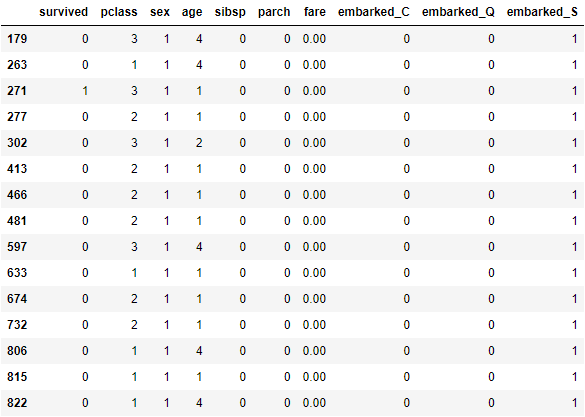
重設票價 0 為至少 1 塊錢:
df[df['fare'] == 0] = 1
df.iloc[[179,  263, 271, 277, 302]]

歸一化:
import numpy as np
df['fare'] = np.log(df['fare'])
df.head()

資料整理完成後 方可確認各個資訊間的關聯,以下用熱力圖做範例:
sns.set(style='ticks', color_codes=True)
plt.figure(figsize=(14, 12))
sns.heatmap(df.corr(), linewidths=0.1, square=True, linecolor='w', annot=True)
plt.show()
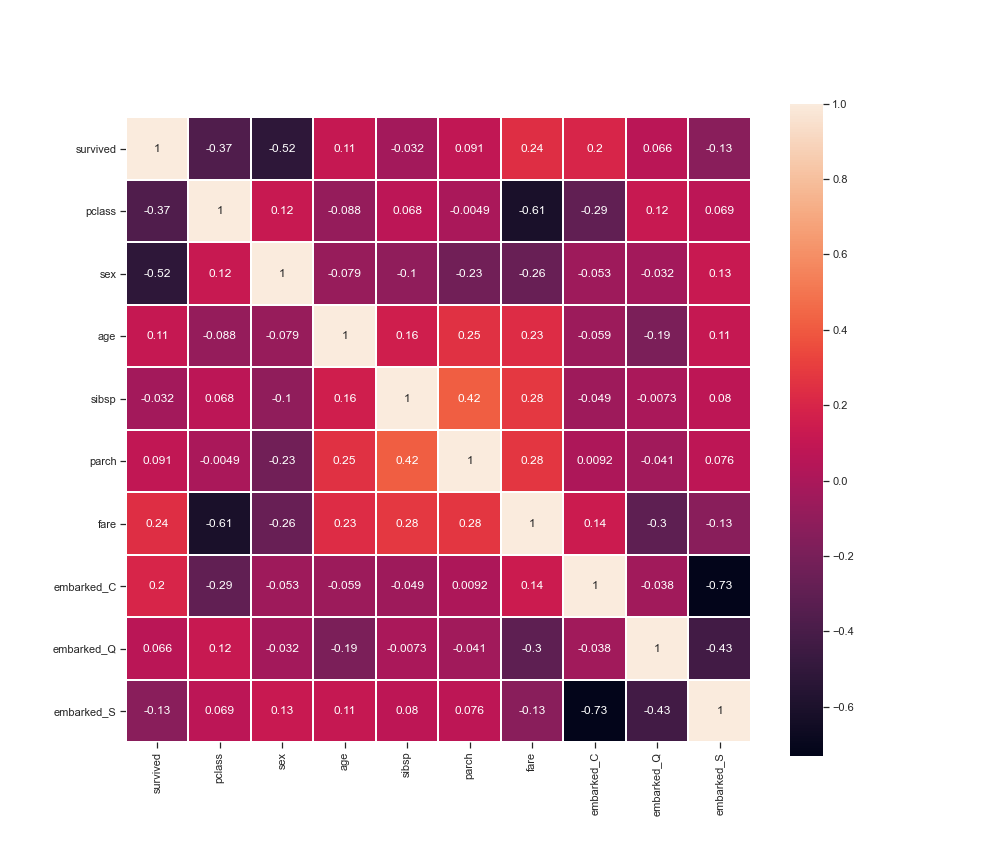
從以上分析可知:生存機率與艙等、性別高度相關。
from sklearn.model_selection import train_test_split
y = df['survived']
X = df.drop('survived', axis=1)

X_train, X_test, y_train, y_test = train_test_split(X, y, test_size=0.2)
為使收斂速度加快,通常在切割資料後會進行以下步驟其一:
兩種方式皆可,在此處使用標準化:
from sklearn.preprocessing import StandardScaler
stdsc = StandardScaler()

X_train_std = stdsc.fit_transform(X_train)
X_test_std = stdsc.transform(X_test)
此處我們採用 LGBMClassifier 演算法
import lightgbm as lgb
from lightgbm import LGBMClassifier

clf = lgb.LGBMClassifier(
    objective = 'binary',
    learning_rate = 0.05,
    n_estimators = 100,
    random_state=0)

clf.fit(X_train_std, y_train)
clf.score(X_test_std, y_test)
>>  0.8212290502793296
我們可以利用一些簡單的 AutoML,將所有演算法/參數跑一遍並評估可行性:
from lazypredict.Supervised import LazyRegressor, LazyClassifier

cls = LazyClassifier(ignore_warnings=False, custom_metric=None)
models, predictions = cls.fit(X_train_std, X_test_std, y_train, y_test)
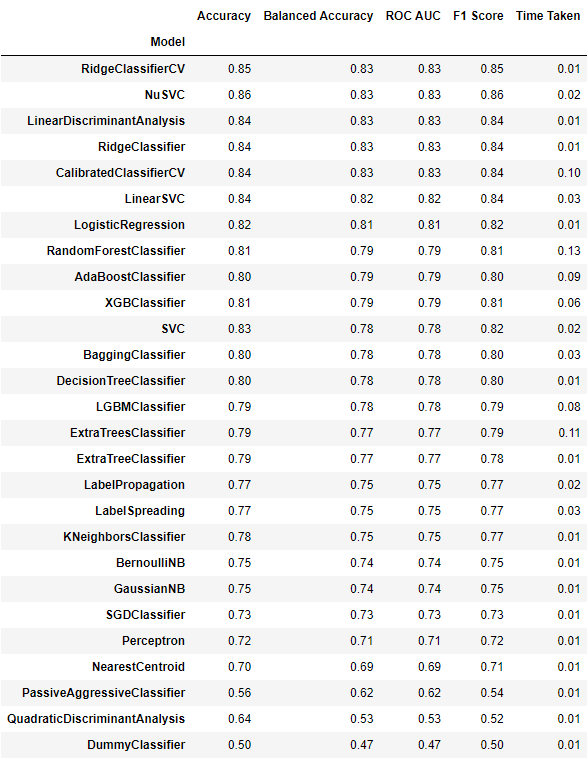
sklearn 有提供一內建存取方式
import joblib

model_file_name = 'model clf.joblib'
joblib.dump(clf, model_file_name)
讀取方式:
clf_load = joblib.load('model clf.joblib')
接著試著輸入資料來使用演算法
根據 EDA 的過程,會需要以下轉換函式
import pandas as pd
import numpy as np

def convent_sex(sex):
    return 1 if sex=='male' else 0


def convnet_age(age):
    bins=[0, 12, 22, 30, 50, 60, 100]
    return pd.cut([age], bins, labels=[5, 2, 1, 4, 3, 0])[0]

dict1 = {'C': 0, 'Q':1, 'S':2}
def convnet_embarked(embarked):
    x = dict1[embarked]
    if x == 0:
        return 1, 0, 0
    elif  x == 1:
        return 0, 1, 0
    elif  x == 2:
        return 0, 0, 1
Method 1. 用 list 輸入 (轉成 np array/DataFram)
X = []
X.append([2, convent_sex('male'), convnet_age(31), 1, 2, np.log(32), *convnet_embarked('Q')])
X.append([1, convent_sex('female'), convnet_age(28), 1, 2, np.log(500), *convnet_embarked('Q')])
X=np.array(X)
丟進演算法中
X_test = stdsc.transform(X)
y = clf_load.predict(X_test)

y
>>  array([0, 1], dtype=int64)
Method 2. 用 dict 輸入 (轉成 np array/DataFram)
X_1 = {
    'pclass':2,
    'sex': convent_sex('male'),
    'age': convnet_age(31),
    'sibsp': 1,
    'parch': 2,
    'fare': np.log(32),
    'embarked_C': 1, 'embarked_Q': 0, 'embarked_S': 0
    }
X_2 = {
    'pclass':3,
    'sex': convent_sex('female'),
    'age': convnet_age(28),
    'sibsp': 1,
    'parch': 2,
    'fare': np.log(500),
    'embarked_C': 1, 'embarked_Q': 0, 'embarked_S': 0
    }

df = pd.DataFrame([X_1, X_2], index=[0, 1])
df

丟進演算法中
X_test = stdsc.transform(df)
y = clf_load.predict(X_test)

y
>>  array([0, 1], dtype=int64)
EDA 為在資料收集完成後的前處理,相對其他步驟來說,是最重要的步驟。
若資料處理(補償、合併、刪除)不夠全面,將導致演算法 output 出一個不夠全面的模型,使預測失準。
.
.
.
.
.
*補充1.:
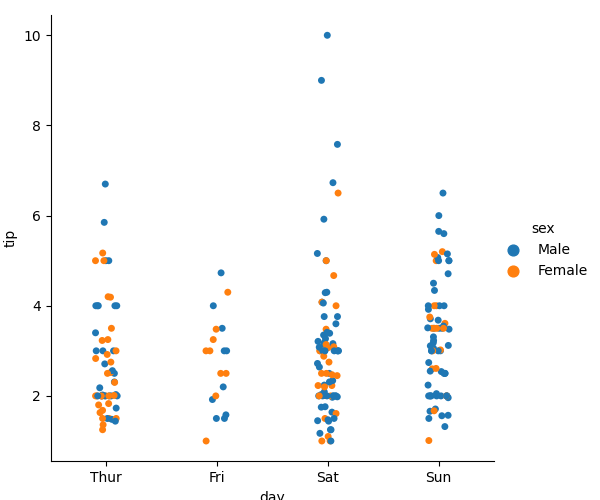
絕對散部圖 sns.catplot:用在 x y 關係為絕對
sns.catplot(x='day', y='tip', data=tips, hue='sex')
.
.
.
.
.
使用假設檢定,檢定近40年(10屆)美國總統的身高是否有差異?
(Data: president_height.csv)
import pandas as pd
df = pd.read_csv('./president_heights.csv')
height = df['height(cm)']
from scipy import stats
sample1 = height.head(len(df)-10)
sample2 = height.tail(10)
z, p = stats.ttest_ind(sample1, sample2)
print(f'Z-value: {z}')
>>  Z-value: -2.69562113651512
print(f'P-value: {p}')
>>  P-value: 0.010226470347307223
# 根據 sample1 平均值 & 樣本標準差,劃出抽取 100000 次分配
s1_bar = np.random.normal(sample1.mean(), sample1.std(), 100000)
plt.hist(s1_bar, bins=100)
plt.axvline(s1_bar.mean(), c='y', linestyle='--', linewidth=2)

# 計算信心水準 95%,雙尾檢定結果(一邊 2.5%)的 x_bar 值
ci = stats.norm.interval(0.95, s1_bar.mean(), s1_bar.std())
plt.axvline(ci[0], c='r', linestyle='--', linewidth=2)
plt.axvline(ci[1], c='r', linestyle='--', linewidth=2)

# 根據 mean + t*s 劃出對立假設 x_bar 落點
plt.axvline(s1_bar.mean() + z*s1_bar.std(), c='m', linestyle='--', linewidth=2)
plt.savefig('pic HW9-2')
plt.show()
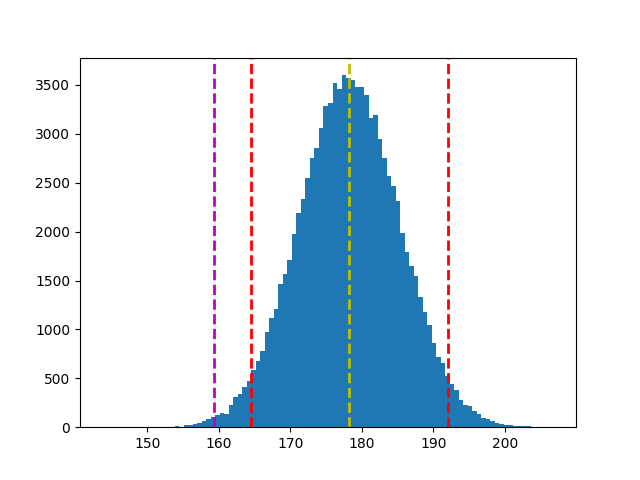
結論:近40年(10屆)美國總統的身高有顯著異於前任總統。
.
.
.
.
.
請參考鐵達尼號的流程,使用鑽石清理資料來完成演算法。
