docker 提供了提供了多個指令可以讓我以 文字的 方式了解 image
但是... 人都是懶惰的(至少我是這樣啦),看圖總比看文字容易
如果能把 image layer 以可視化(visualization)的方式呈現,應該可以更容易理解到底 層vs層 之間纏纏綿綿的關係
今天來看看 nate/dockviz container 以及 Graphviz ,來 trytry image layer visualization
brew install graphviz

.... 800年沒有 brew install 東西了 光 update 就花了快十分鐘,還以為 treminal 掛惹...
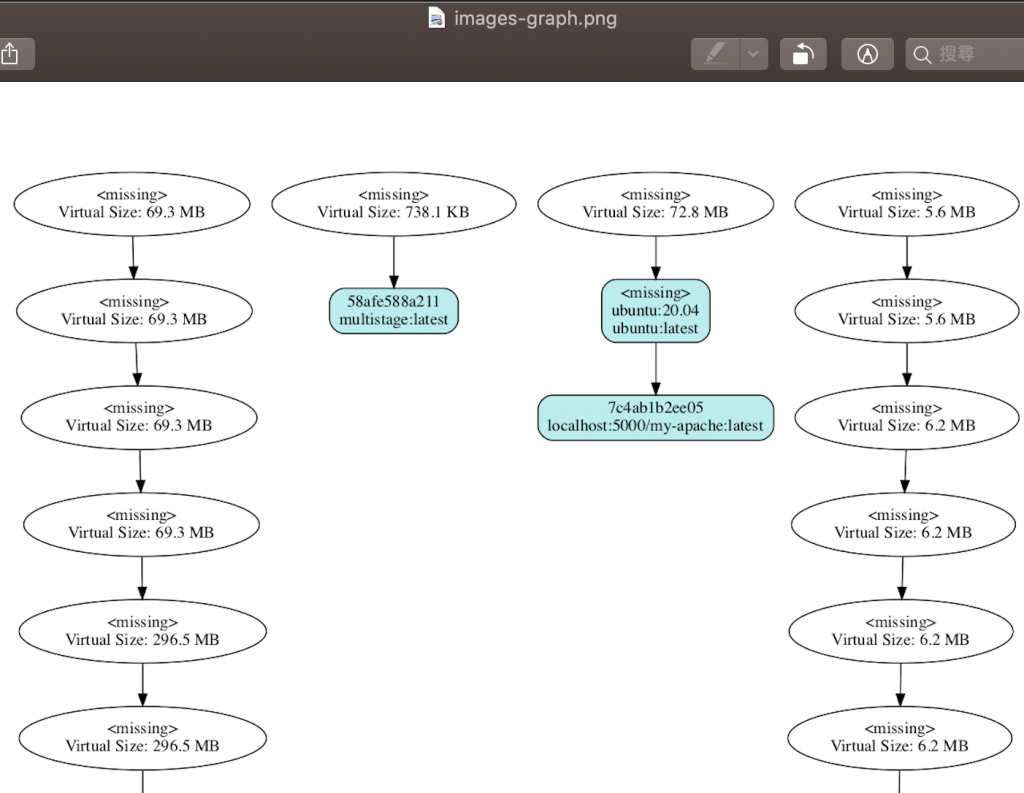
執行 nate/dockiv container 並提供 images --dot 作為參數,把 out put 輸出到 dot(Graphviz) 中,以下指令中,讓我們來產生一張 image layer structure 的圖吧
docker run --rm -v /var/run/docker.sock:/var/run/docker.sock nate/dockviz images --dot | dot -Tpng -o images-graph.png
可以看到 image 如何 一層一層的推演
其實也就是把 history 的東西圖像化
關於這個 < missing > 的部分...
看起來 missing 似乎是有點在誤導人,但實際上他並沒有錯誤
there is no error as layers are no longer synonymous with a corresponding image and ID
layer 並不是 image_id 的同義詞
the image ID appears to be associated with the uppermost layer, but in fact, the image ID doesn't 'belong' to any of the layers
list 中,每層的 image 似乎有關聯,但實際上他們並不屬於任一層
資料來源:https://windsock.io/explaining-docker-image-ids/
