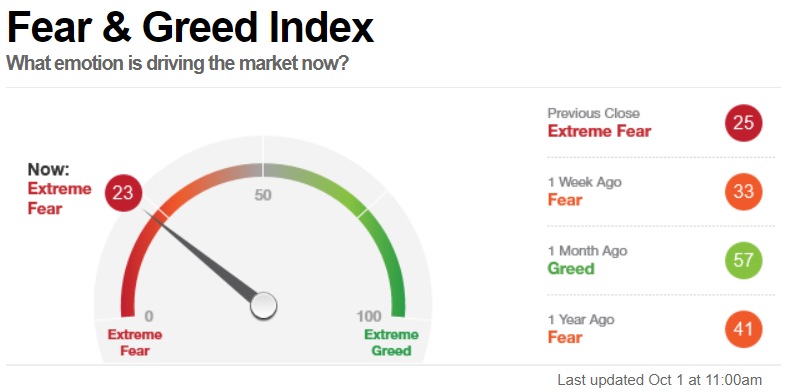
最近股市只有一個字
怕.jpg

今天研究了大多的回測策略,大多都是以日計算,想想可不可以用 1分K 回測看看,研究了一下如何將永豐API的 Kbar 傳換成 backtrader 的 feeds,然後跑個簡單回測看看效果如何
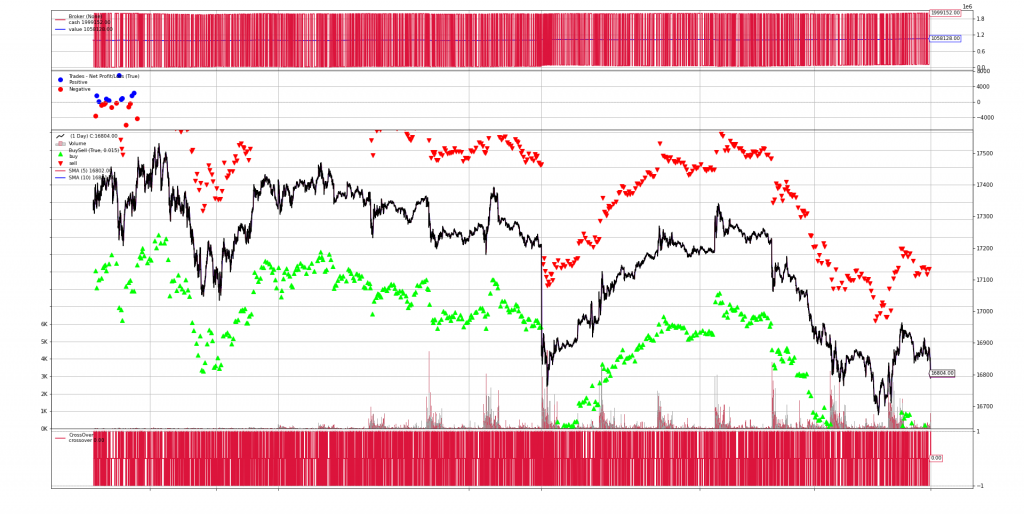
今天來測試9/1到9/30 台指期的1分K,發現1分K資料量用圖呈現出來資料量也蠻驚人的
kbars = api.kbars(api.Contracts.Futures.TXF['TXF202110'], start="2021-09-01", end="2021-09-30")

df = pd.DataFrame({**kbars})
df.ts = pd.to_datetime(df.ts)
df
	Close	ts	Volume	Open	High	Low
0	17340.0	2021-09-01 00:27:00	1	17340.0	17340.0	17340.0
1	17325.0	2021-09-01 02:48:00	2	17326.0	17326.0	17325.0
2	17325.0	2021-09-01 02:54:00	4	17325.0	17325.0	17325.0
3	17321.0	2021-09-01 03:11:00	2	17322.0	17322.0	17321.0
4	17320.0	2021-09-01 03:23:00	1	17320.0	17320.0	17320.0
...	...	...	...	...	...	...
16399	16803.0	2021-09-30 23:56:00	119	16804.0	16805.0	16795.0
16400	16800.0	2021-09-30 23:57:00	138	16803.0	16808.0	16800.0
16401	16797.0	2021-09-30 23:58:00	94	16801.0	16802.0	16797.0
16402	16806.0	2021-09-30 23:59:00	120	16796.0	16807.0	16795.0
16403	16804.0	2021-10-01 00:00:00	94	16805.0	16809.0	16803.0
16404 rows × 6 columns
df.columns = ['close', 'datetime', 'volume', 'open', 'high', 'low' ]
df.set_index('datetime', inplace=True)

class pandasDataFeed(bt.feeds.PandasData):
  params = (
      ('datetime', -1),
      ('high', 'high'),
      ('low', 'low'),
      ('open', 'open'),
      ('close', 'close'),
      ('volume', 'volume')
  )
data = pandasDataFeed(dataname=newdf)

# feed data
cerebro.adddata(data)
print('Starting Portfolio Value: %.2f' % cerebro.broker.getvalue())
# add strategy
cerebro.addstrategy(SmaCross)

cerebro.broker.set_cash(1000000.0)
# run backtest
cerebro.run()
2021-09-01 08:50:00, BUY , Price: 17336.0
2021-09-01 08:50:00, BUY , Price: 17336.0
2021-09-01 08:54:00, SELL , Price: 17340.0
2021-09-01 08:54:00, SELL , Price: 17340.0
2021-09-01 09:18:00, SELL , Price: 17377.0
2021-09-01 09:18:00, SELL , Price: 17377.0
2021-09-01 09:26:00, SELL , Price: 17373.0
2021-09-01 09:26:00, SELL , Price: 17373.0
...
# plot diagram
cerebro.plot(height = 30, iplot = False)
plt.show()
結果呈現如下圖,買賣訊號非常多,似乎有些許的獲利,還要補上摩擦成本計算,明天來調整一下投入資金與策略微調吧
