在 EP25 和 EP26,
我們為 EKS 配置了 Grafana 和 Loki,
讓我們可以透過儀表板查看 Log,雖然範例 AP 根本沒有設定 Log,
今天我們將繼續進行,
在 EKS 設定 Container Insights,
這樣我們就可以查看容器的使用狀況。
CloudWatch 為 AWS 的監控工具
而 Container Insights(譯作容器洞見)是 CloudWatch 的一個 feature
CloudWatch 會自動收集許多資源的指標
例如 CPU、記憶體、磁碟和網路
容器洞見還提供診斷資訊
例如容器重新啟動故障
協助您快速隔離和解決這些故障
使用 Container Insights 的好處
在於你可以串接 AWS CloudWatch 的告警機制
並且 Grafana 也可以整合 AWS CloudWatch
可以使用 Grafana 統一做為內部系統監控的儀表板
resource "aws_iam_role_policy_attachment" "ec2_profile_cloudwatch_agent_service" {
    policy_arn = "arn:aws:iam::aws:policy/CloudWatchAgentServerPolicy"
    role       = aws_iam_instance_profile.ec2_profile.name
}
記得將 aws-stage-cluster 替換成你的 cluster 名稱
將 ap-northwast-1 替換成 cluster 所屬區域
curl https://raw.githubusercontent.com/aws-samples/amazon-cloudwatch-container-insights/latest/k8s-deployment-manifest-templates/deployment-mode/daemonset/container-insights-monitoring/quickstart/cwagent-fluentd-quickstart.yaml | sed "s/{{cluster_name}}/aws-stage-cluster/;s/{{region_name}}/ap-northeast-1/" | kubectl apply -f -
mkdir /vagrant_data/project/k8s-resources
cd /vagrant_data/project/k8s-resources
kubectl apply -f https://raw.githubusercontent.com/aws-samples/amazon-cloudwatch-container-insights/latest/k8s-deployment-manifest-templates/deployment-mode/daemonset/container-insights-monitoring/cloudwatch-namespace.yaml
kubectl apply -f https://raw.githubusercontent.com/aws-samples/amazon-cloudwatch-container-insights/latest/k8s-deployment-manifest-templates/deployment-mode/daemonset/container-insights-monitoring/cwagent/cwagent-serviceaccount.yaml
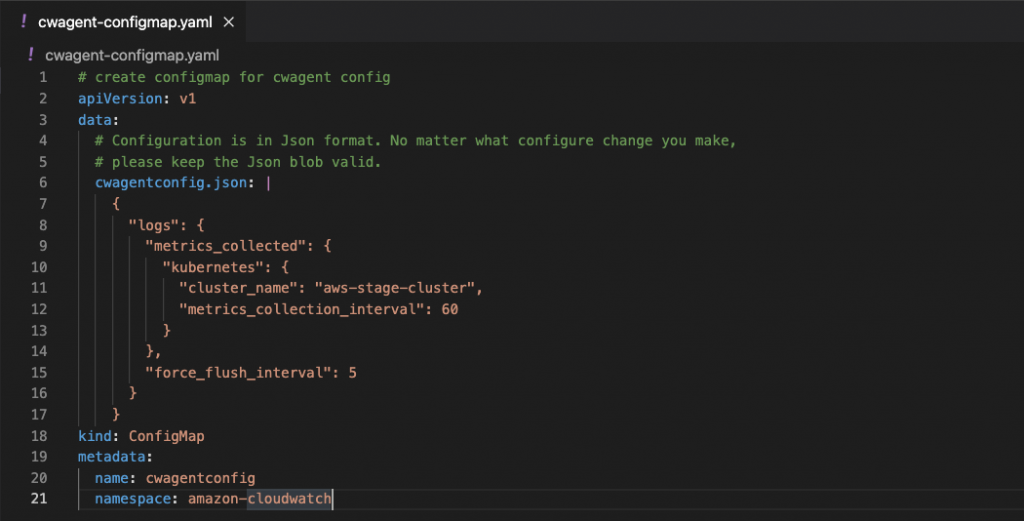
curl -O https://raw.githubusercontent.com/aws-samples/amazon-cloudwatch-container-insights/latest/k8s-deployment-manifest-templates/deployment-mode/daemonset/container-insights-monitoring/cwagent/cwagent-configmap.yaml
編輯已下載的 YAML 檔案
在 kubernetes 區塊中的 cluster_name
將 {{cluster-name}} 取代為自己的叢集名稱
登入後會自動幫你建立四個日誌群組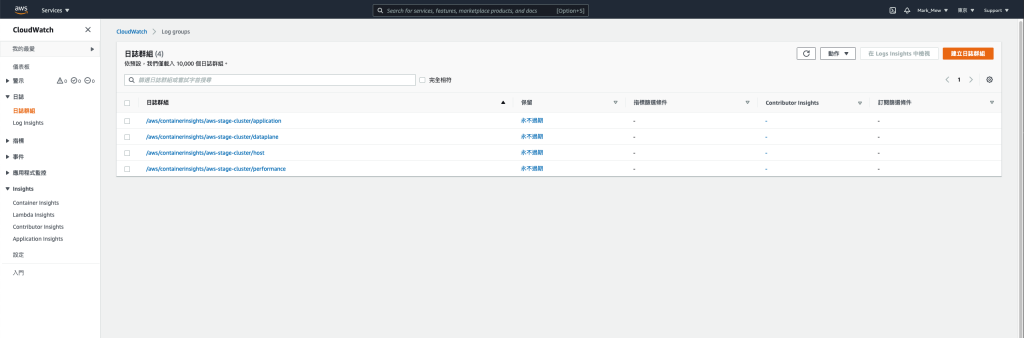
Container Insights 也可以根據 Pods、Namespace
去查看資源的使用狀況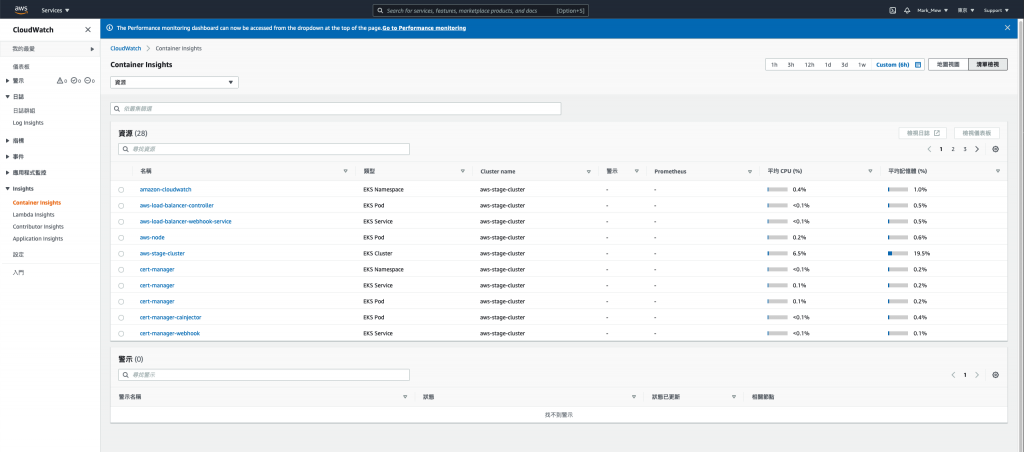
stage/main.tf
resource "aws_iam_user" "grafana" {
    name = "Grafana"
    path = "/"

    tags = {
        Name    = "Grafana"
        Usage   = "Grafana"
        Creator = "Terraform"
    }
}

resource "aws_iam_access_key" "grafana" {
    user = aws_iam_user.grafana.name
}

resource "aws_iam_user_policy" "grafana_cloudwatch" {
    name = "GrafanaCloudWatchLimited"
    user = aws_iam_user.grafana.name

    policy = <<EOF
{
  "Version": "2012-10-17",
  "Statement": [
    {
      "Action": [
        "cloudwatch:DescribeAlarmsForMetric",
        "cloudwatch:DescribeAlarmHistory",
        "cloudwatch:DescribeAlarms",
        "cloudwatch:ListMetrics",
        "cloudwatch:GetMetricStatistics",
        "cloudwatch:GetMetricData"
      ],
      "Effect": "Allow",
      "Resource": "*"
    },
    {
      "Action": [
        "logs:DescribeLogGroups",
        "logs:GetLogGroupFields",
        "logs:StartQuery",
        "logs:StopQuery",
        "logs:GetQueryResults",
        "logs:GetLogEvents"
      ],
      "Effect": "Allow",
      "Resource": "*"
    },
    {
      "Action": [
        "ec2:DescribeTags",
        "ec2:DescribeInstances",
        "ec2:DescribeRegions"
      ],
      "Effect": "Allow",
      "Resource": "*"
    },
    {
      "Action": "tag:GetResources",
      "Effect": "Allow",
      "Resource": "*"
    }
  ]
}
EOF
}
stage/outputs
output "grafana_secret_token" {
    description = "Decrypt access secret key command"
    value       = aws_iam_access_key.grafana.secret
    sensitive   = true
}
terraform apply
記起來等等會用到
terraform output grafana_secret_token
畫面左側有的齒輪點下去
可以設定 datasource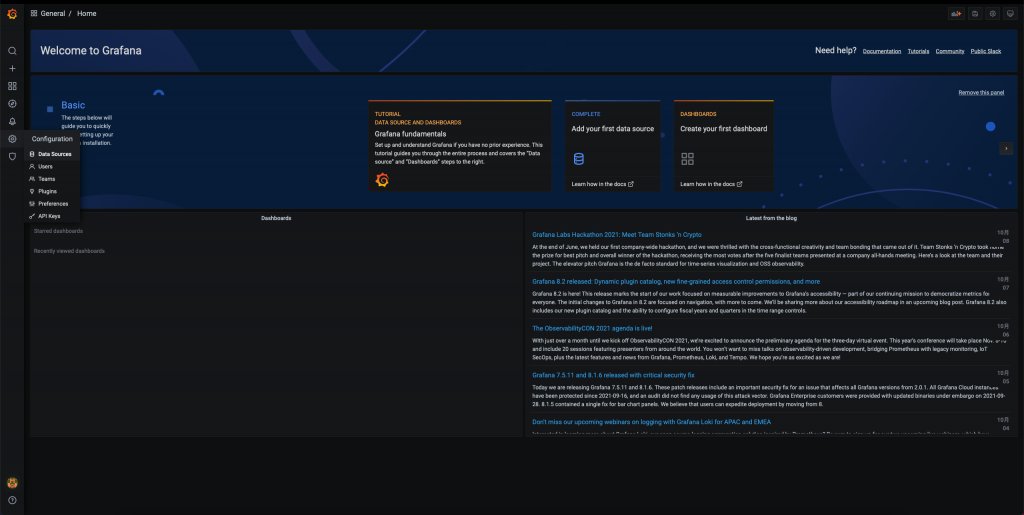
選擇 CloudWatch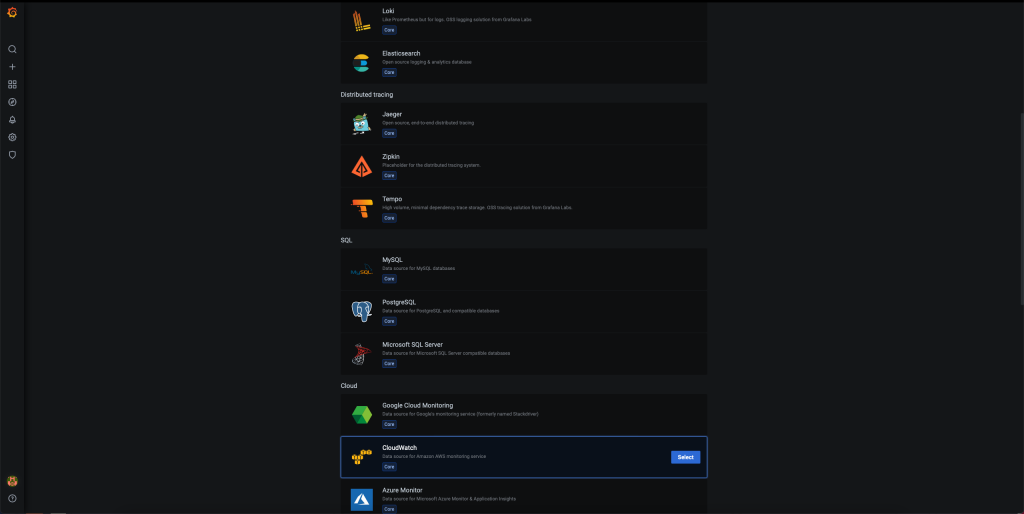
填入 IAM 資訊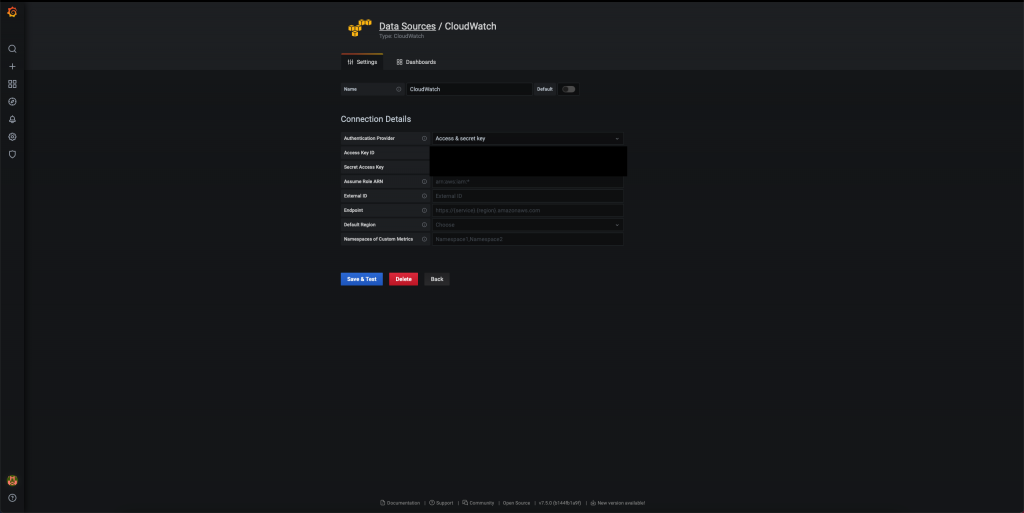
Add Empty Panel 以後其實畫面任意點選就可以出現了
需要注意的是 Grafana 的版本不能太舊(如:6.7版)
之前曾經不小心使用到太舊的版本
導致 CloudWatch Logs 無法正常顯示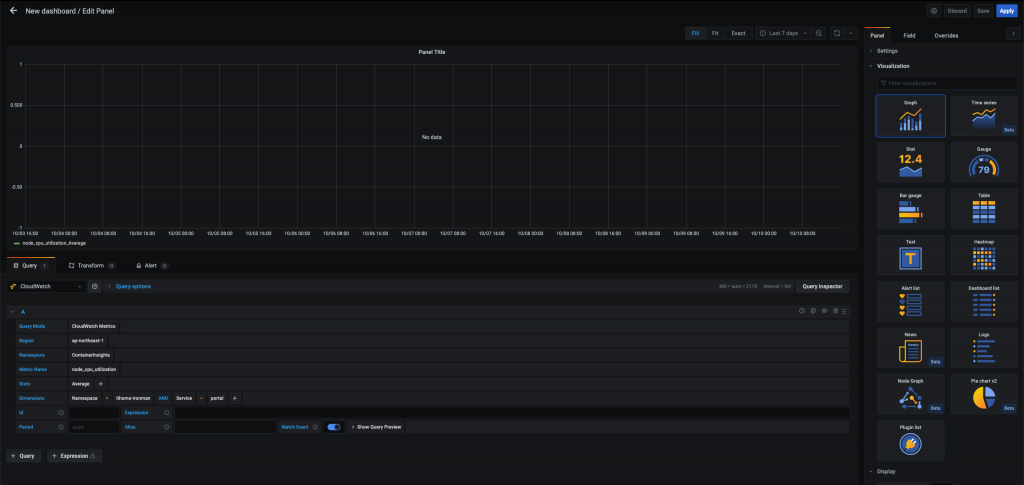
其實我們今天的快速設定
就已經間接的多使用到 fluetd 紀錄 Log
並透過 CloudWatch Agent 轉發到 CloudWatch Log 上
會考慮這樣無腦的使用
則是因為 Log 存放時間的考量
當公司成長到一定規模
就會開始制定管理辦法
此時 Log 的管理就會是個問題
今天將 Log 轉發到 CloudWatch Log 上
可以將 Log 長久的保存下來
也可以維持 Log 的不可變更性
如果公司要取得一些認證
那 Log 的保存選擇用 CloudWatch 會是個不錯的選擇
參考資料:


 iThome鐵人賽