今晚來點輕鬆的。資料視覺化,複習一下DataFrame、seaborn
引用資料來源:country_vaccination.csv Kaggle Dataset
該資料集記錄各國施打COVID疫苗的逐日報表,是從Our World in Data網站收集整理出來的。說明:
Data is collected daily from Our World in Data GitHub repository for covid-19, merged and uploaded. Country level vaccination data is gathered and assembled in one single file. Then, this data file is merged with locations data file to include vaccination sources information.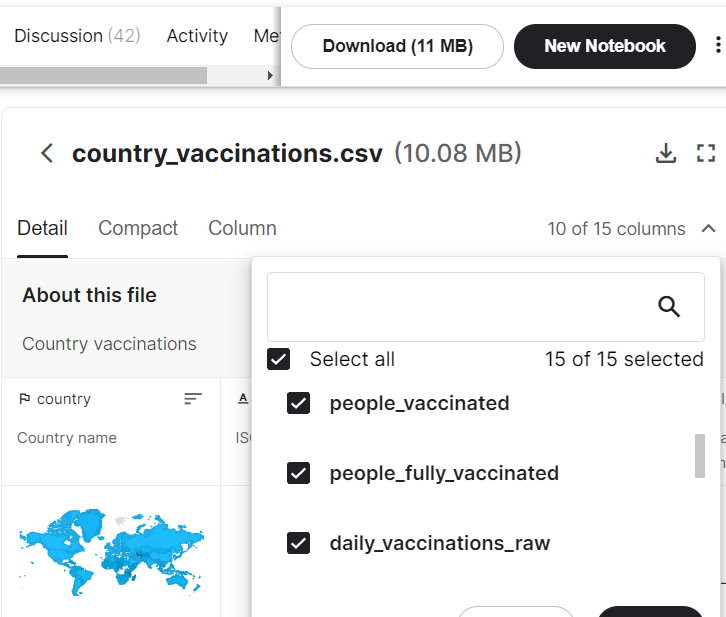
Step 1. 載入資料集:使用pandas DataFrame
本文內相關的欄位是country、total_vaccinations、daily_vaccinations。
Step 2. 依國家別分群、找出國家別是”Taiwan”者( 202筆,資料日截至2021-10-09)
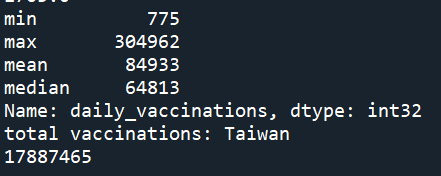
Step 3. 統計 daily_vaccinations 的min max mean median
Step 4. barplpot 畫 每日接種人數 seaborn
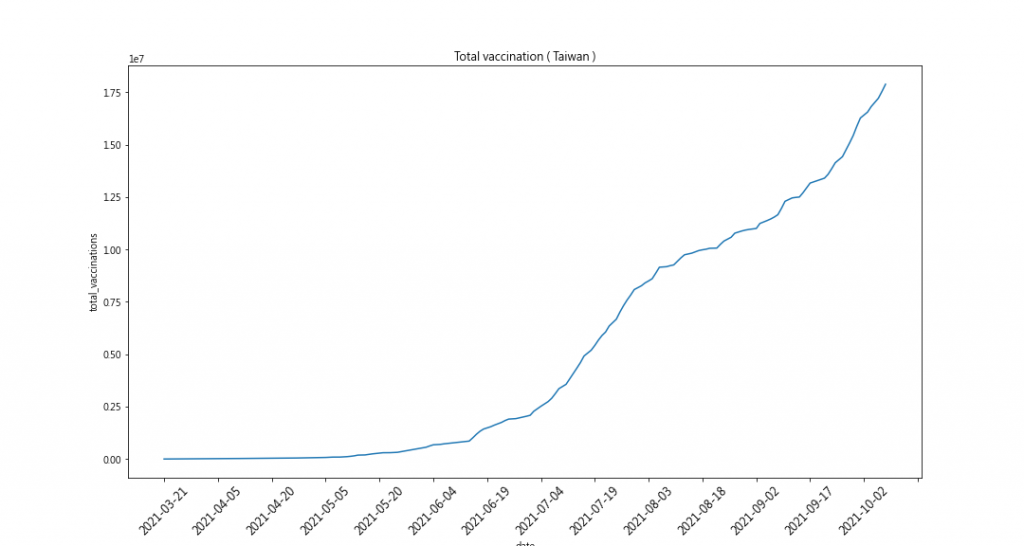
Step 5. lineplot 畫 累計人數逐日圖
成果圖: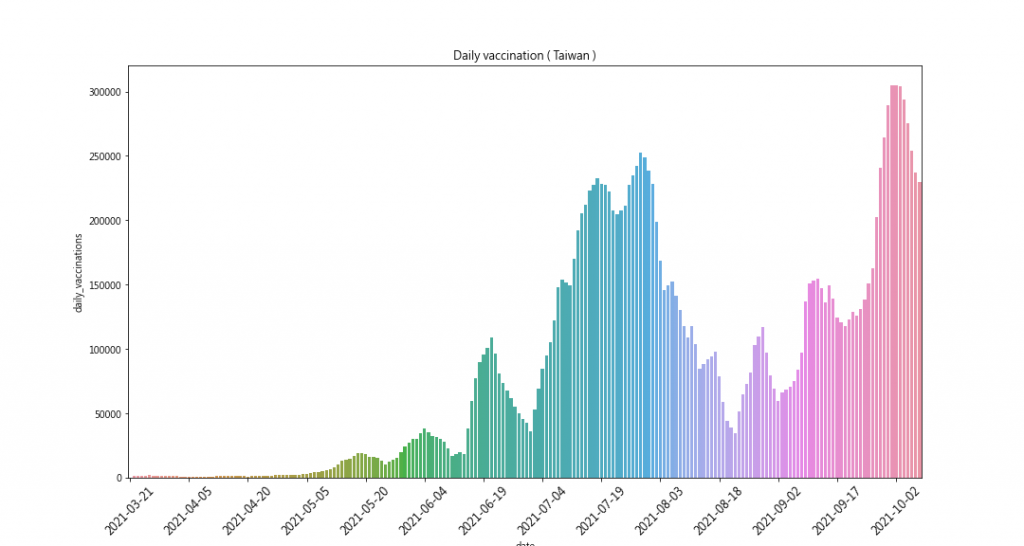
Source code
# vaccine_sn02.py
import numpy as np
import pandas as pd
import seaborn as sn
from matplotlib import rcParams
from matplotlib.ticker import MultipleLocator
import matplotlib.pyplot as plt
import matplotlib.ticker as ticker


''' 以dataframe 讀取csv '''
print('以dataframe 讀取 csv')
df = pd.read_csv('country_vaccinations.csv')
# 依國家別分群
df = df.groupby('country')
# 找出國家別是”Taiwan”者 (資料日截至2021-10-09)
dfT = df.get_group('Taiwan')
print(f'符合的記錄數目: {dfT.count}')
# 只取四欄位
dfTwn = dfT[['country','date','total_vaccinations','daily_vaccinations']]
print(dfTwn.head())
# 統計 daily_vaccinations 的 min max mean median
stat1 = dfTwn['daily_vaccinations'].aggregate(['min', 'max', 'mean', 'median'])
stat1 = stat1.astype(int)
print(stat1)
# total_vaccinations 累計接種人數之最大值
print(f'total vaccinations: Taiwan\n{int(dfTwn["total_vaccinations"].max())}')

# barplpot 畫 每日接種人數 seaborn
rcParams['figure.figsize'] = 15,8
xmajorLocator = MultipleLocator(15)
ax = sn.barplot(x=dfTwn['date'],y=dfTwn['daily_vaccinations'],data= dfTwn)
ax.set_xticklabels(ax.get_xticklabels(),rotation = 45,size=12)
ax.xaxis.set_major_locator(xmajorLocator)
ax.set_title('Daily vaccination ( Taiwan )')
# 存檔
plt.savefig('Vaccine_TaiwanDaily.png')
plt.figure()

# lineplot 畫 累計人數逐日圖
xmajorLocator = MultipleLocator(15)
ax2 = sn.lineplot(data= dfTwn,x=dfTwn['date'],y=dfTwn['total_vaccinations'])
plt.xticks(rotation=45,size=12)
ax2.xaxis.set_major_locator(xmajorLocator)
ax2.set_title('Total vaccination ( Taiwan )')
plt.savefig('Vaccine_TaiwanTotal.png')
附帶題外:Our World in Data 網頁還可以動態的以地圖顯示,隨著時間的進行,各地區接種人數的增長動態。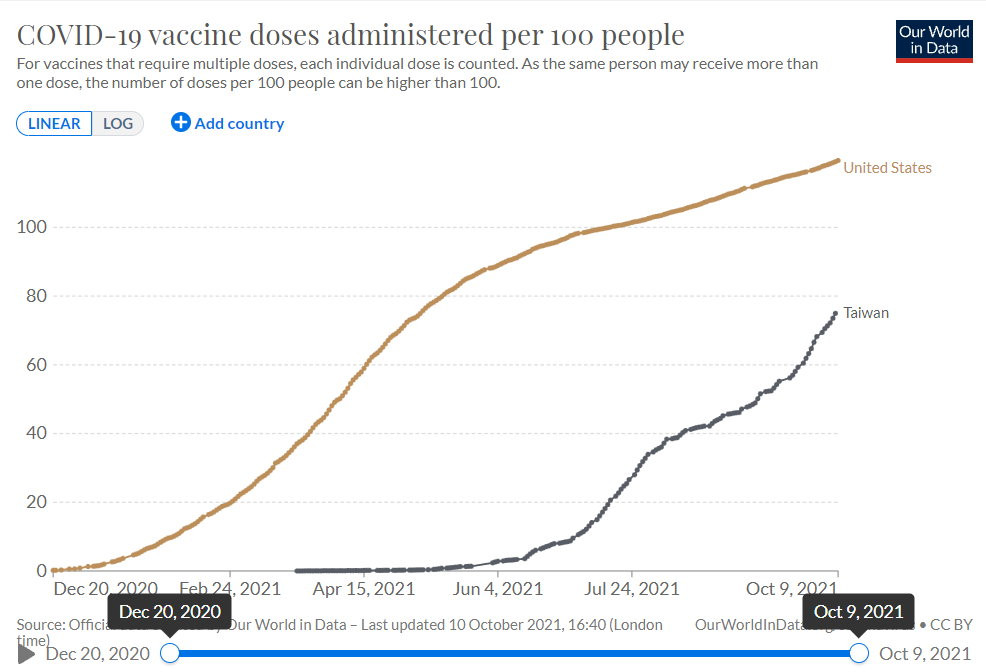
 neocaffe
