閒聊
昨天第一次使用csv檔案,今天繼續往其他功能前進!
今天我們來利用CSV檔案來繪製圖表。
繪製氣象圖表
首先,我們會先有一份台北2022年1月的氣溫紀錄。
(已是CSV檔)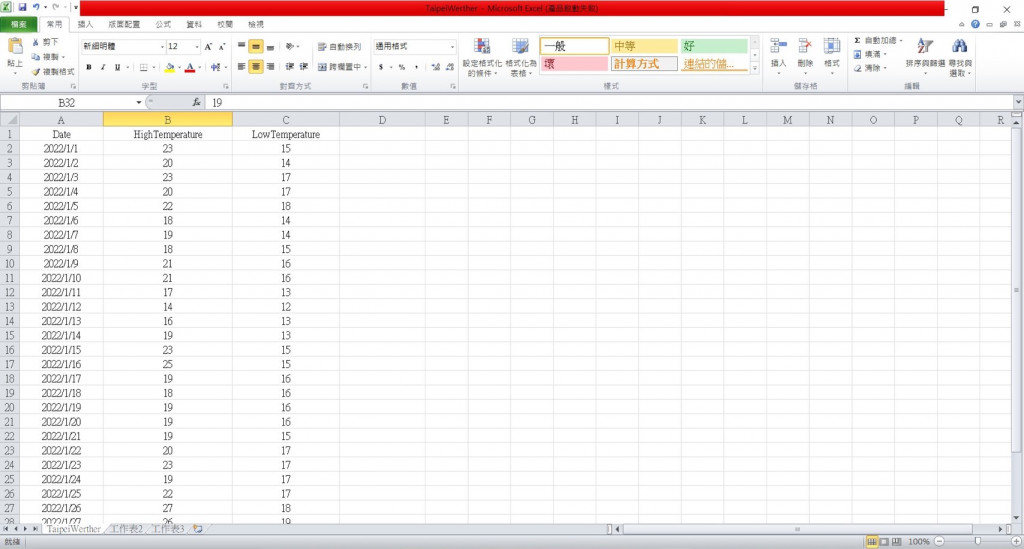
#標題列
import csv

file = 'TaipeiWeather.csv'
with open(file) as csvFile : #開啟檔案
    csvReader = csv.reader(csvFile) #建立Reader物件
    headerRow = next(csvReader) #讀取文件下一行
print(headerRow)
#output
['Date', 'HighTemperature', 'LowTemperature']
#標題資料
import csv

file = 'TaipeiWeather.csv'
with open(file) as csvFile : #開啟檔案
    csvReader = csv.reader(csvFile) #建立Reader物件
    headerRow = next(csvReader) #讀取文件下一行
for i,header in enumerate(headerRow) : #enumerate()多用於在for循環中得到計數,可以同時獲得索引和值
    print(i,headerRow)
#output
0 Date
1 HighTemperature
2 LowTemperature
import csv

file = 'TaipeiWeather.csv'
with open(file) as csvFile :
    csvReader = csv.reader(csvFile)
    headerRow = next(csvReader)
    highTemps, lowTemps = [], [] #建立最高溫、最低溫串列
    for row in csvReader :
        highTemps.append(row[1]) #儲存最高溫(表格中第二個位置)
        lowTemps.append(row[2]) #儲存最低溫(表格中第三個位置)

print("最高溫 :", highTemps)
print("最低溫 :", lowTemps)
#output
最高溫 : ['23', '20', '23', '20', '22', '18', '19', '18', '21', '21', '17', '14', '16', '19', '23', '25', '19', '18', '19', '19', '19', '20', '23', '19', '22', '27', '26', '21', '19', '16', '19']
最低溫 : ['15', '14', '17', '17', '18', '14', '14', '15', '16', '16', '13', '12', '13', '13', '15', '15', '16', '16', '16', '16', '15', '17', '17', '17', '17', '18', '19', '17', '16', '13', '13']
import csv
import matplotlib
import matplotlib.pyplot as plt
file = 'TaipeiWeather.csv'
with open(file) as csvFile :
csvReader = csv.reader(csvFile)
headerRow = next(csvReader)
highTemps = [] #設定最高溫串列
for row in csvReader :
highTemps.append(int(row[1])) #將串列轉乘int(),並儲存最高溫
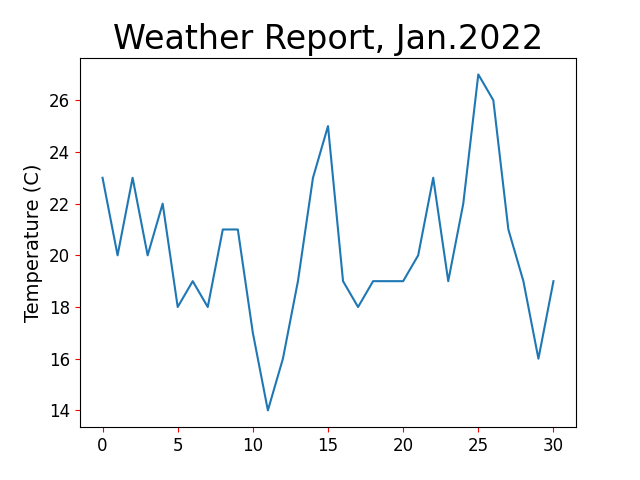
plt.plot(highTemps)
plt.title('Weather Report, Jan. 2022',fontsize = 24)
plt.xlabel("", fontsize = 14)
plt.ylabel("Temperature (C)", fontsize = 14)
plt.tick_params(axis = 'both', labelize = 12, color = 'red')
plt.show()
try-expect的用法。這樣可以避免如果資料有誤或是有缺失的時候,讓程式繼續運行。import csv
import matplotlib
import matplotlib.pyplot as plt
file = 'TaipeiWeather.csv'
with open(file) as csvFile :
csvReader = csv.reader(csvFile)
headerRow = next(csvReader)
highTemps = [] #設定最高溫串列
lowTemps = [] #設定最低溫串列
for row in csvReader :
try :
highTemp = int(row[1])
lowTemp = int(row[2])
except Exception :
print('有缺值')
else :
highTemps.append(highTemp)
lowTemps.append(lowTemp)
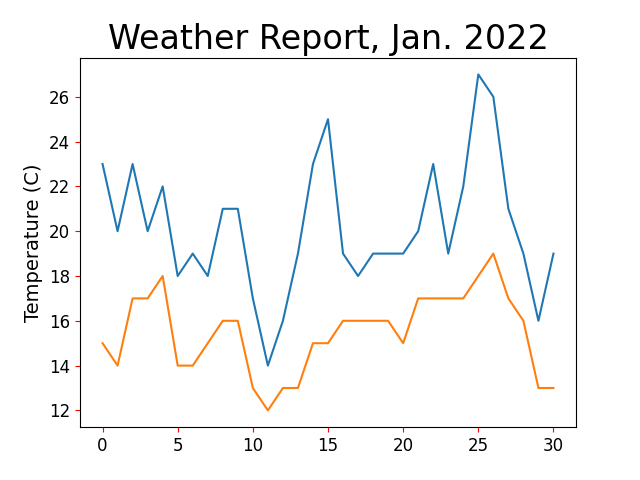
plt.plot(highTemps)
plt.plot(lowTemps)
plt.title('Weather Report, Jan. 2022',fontsize = 24)
plt.xlabel("", fontsize = 14)
plt.ylabel("Temperature (C)", fontsize = 14)
plt.tick_params(axis = 'both', labelsize = 12, color = 'red')
plt.show()
fill_between()方法import csv
import matplotlib
import matplotlib.pyplot as plt
file = 'TaipeiWeather.csv'
with open(file) as csvFile :
csvReader = csv.reader(csvFile)
headerRow = next(csvReader)
highTemps = [] #設定最高溫串列
lowTemps = [] #設定最低溫串列
for row in csvReader :
try :
highTemp = int(row[1])
lowTemp = int(row[2])
except Exception :
print('有缺值')
else :
highTemps.append(highTemp)
lowTemps.append(lowTemp)
plt.plot(highTemps)
plt.plot(lowTemps)
plt.title('Weather Report, Jan. 2022',fontsize = 24)
plt.xlabel("", fontsize = 14)
plt.ylabel("Temperature (C)", fontsize = 14)
plt.tick_params(axis = 'both', labelsize = 12, color = 'red')
plt.fill_between(highTemps, lowTemps, color = 'y', alpha = 0.2)
plt.show()
設定繪圖區大小
方法:figure(dpi = n, figsize = (width,height))
這個方法的「高」是 n*height像素,「寬」是 n*width像素。
在圖表加上日期
在加上日期前,要先了解日期的模組跟格式。
1.導入模組
from datetime import datetime

strptime(str, format) #將日期字串解析成物件
2.格式
| 參數 | 說明 |
|---|---|
| %Y | 4位數年分 |
| %y | 2位數年分 |
| %m | 月份(1-12月) |
| %B | 月份名稱 |
| %A | 星期名稱 |
| %d | 日期(1-31) |
| %H | 24小時 |
| %I | 12小時 |
| %p | AM、PM |
| %M | 分鐘 |
| %S | 秒 |
#實作
import csv
import matplotlib
import matplotlib.pyplot as plt
from datetime import datetime
import csv
import matplotlib
import matplotlib.pyplot as plt
file = 'TaipeiWeather.csv'
with open(file) as csvFile :
    csvReader = csv.reader(csvFile)
    headerRow = next(csvReader)
    highTemps = [] #設定最高溫串列
    lowTemps = [] #設定最低溫串列
    dates = [] #設定日期串列
    for row in csvReader:
        highTemp.append(int(row[1]))
        lowTemp.append(int(row[2]))
        currentDate = datetime.strptime(row[0], "%Y/%m/%d")
        dates.append(currentDate)
plt.plot(highTemps)
plt.plot(lowTemps)
plt.plot(dates) #圖標增加日期
plt.title('Weather Report, Jan. 2022',fontsize = 24)
plt.xlabel("", fontsize = 14)
plt.ylabel("Temperature (C)", fontsize = 14)
plt.tick_params(axis = 'both', labelsize = 12, color = 'red')
plt.show()
autofmt_xdate()。結語
今天用繪製圖表時遇到了很多困難,模組安裝不完全、打錯字......等。
但看到圖表成功跑出來時,還是覺得很開心!〔´∇`〕
明天
【Day 8】一起打開瀏覽器檢查看看吧!
參考資料
氣象資料來源
交通部氣象局https://www.cwb.gov.tw/V8/C/
Python中enumerate用法詳解https://www.796t.com/content/1510942965.html