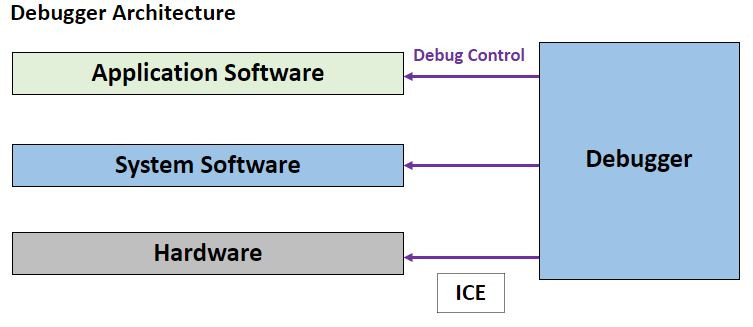
Debugger是一種對程式進行除錯 (debug) 的工具,它可以讓程式停下來、檢查程式運行的狀態,並且控制程式的執行,藉此觀察的程式裡面的變數、函式呼叫、運行步驟,最後發現bug所在。常見的debugger tool: GDB (GNU Debugger)。
若希望GCC編譯出來的檔案帶有debug information,可以使用-g的參數
以此程式為示範: gdb_demo.c
#include <stdio.h>
int x = 3;

int func_b(int in_1, int in_2)
{
    int print_var1 = in_1 + 1;
    int print_var2 = in_2 + 2;
    printf("%d, %d\n", print_var1, print_var2);
    return 0;
}
int func_a(int in_1)
{
    int out_1 = in_1;
    int out_2 = 0;
    for(int i = 0; i< 5; i++)
    {
        out_1 += 1;
        x += 1;
    }
    out_2 = x + 5;
    func_b(out_1, out_2);
    return 0;
}


int main(void)
{
    int y = 1;
    int z = func_a(y);
    z = z + 1;
    return 0;
}
$ gcc –g gdb_demo.c -o gdb_demo.exe
$ gdb gdb_demo.exe
進入gdb
Reading symbols from gdb_demo.exe...
(gdb) br 6
Breakpoint 1 at 0x115b: file gdb_demo.c, line 6.
(gdb) br func_a
Breakpoint 2 at 0x118d: file gdb_demo.c, line 13.
(gdb) br 19
Breakpoint 3 at 0x11b6: file gdb_demo.c, line 19.
(gdb) condition 3 x == 5
(gdb) r
Starting program: /home/ailing/gdb_demo.exe
Breakpoint 2, func_a (in_1=21845) at gdb_demo.c:13
13      {
(gdb) step
14          int out_1 = in_1;
(gdb) p out_1
$1 = 32767
(gdb) set out_1 = 333
$2 = 333
(gdb) backtrace
中斷點breakpoint (b, bre, break): 指定讓程式在執行到特定的function、特定的PC、特定的檔案與行數時停下來、符合特定條件時停下來
單步執行step (s): 讓停下來的程式以一行一行的方式往下執行
印出一個expression print (p): 查看變數值與expression
更改變數值 (set)
堆疊追蹤backtrace (bt): 由當下function的caller一路往回追到最底層的function
在嵌入式系統的開發之中,software developer經常需要知道底層硬體狀態與軟體狀態的關係正確與否,當嵌入式系統本身出現問題、成為被debug的對象時,然而gdb本身是一個軟體,須要有正常的系統軟體才能正常運作,這個時候我們就需要透過remote debug去針對整個系統進行debug。
要被debug的程式運行在裝置A上,但GDB本身則可以運行在裝置B上針對裝置A上的程式debug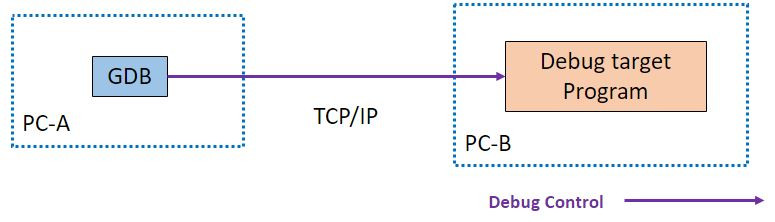
ICE: 在CPU上直接進行debug的硬體裝置
Software developer要對嵌入式系統做debug的時候,通常需要能夠連上CPU的ICE操作GDB的功能,才可以知道整體系統的狀態,因為GDB沒有辦法直接對硬體IC下指令,所以需要搭配一些工具。
我們以GDB搭配JTAG (Joint Test Action Group,用以測試嵌入式系統的一種電氣協定)控制硬體為例
Debug command translator: 它是一個程式,內建gdb server接收software developers用gdb client傳送過來的gdb command,再把收到的gdb command轉換為對JTAG hardware debugger的訊號,並且在收到JTAG hardware debugger的回覆時轉換成gdb回覆回傳給gdb client。例如: OpenOCD (Open On-Chip Debugger)
JTAG hardware debugger: 它是一顆晶片,負責把OpenOCD下的debug control訊號轉換成JTAG command打到debug目標硬體上。例如: FTDI FT2232H晶片
JTAG-DP (debug port): 在被debug的硬體上的一個硬體元件,是接收JTAG指令的對口
如下圖: 當software developer從電腦上下GDB指令的時候,OpenOCD會負責把gdb command轉換為對JTAG hardware debugger的訊號,FTDI FT2232H晶片收到指令後把它轉成JTAG command打到JTAG-DP (debug port)上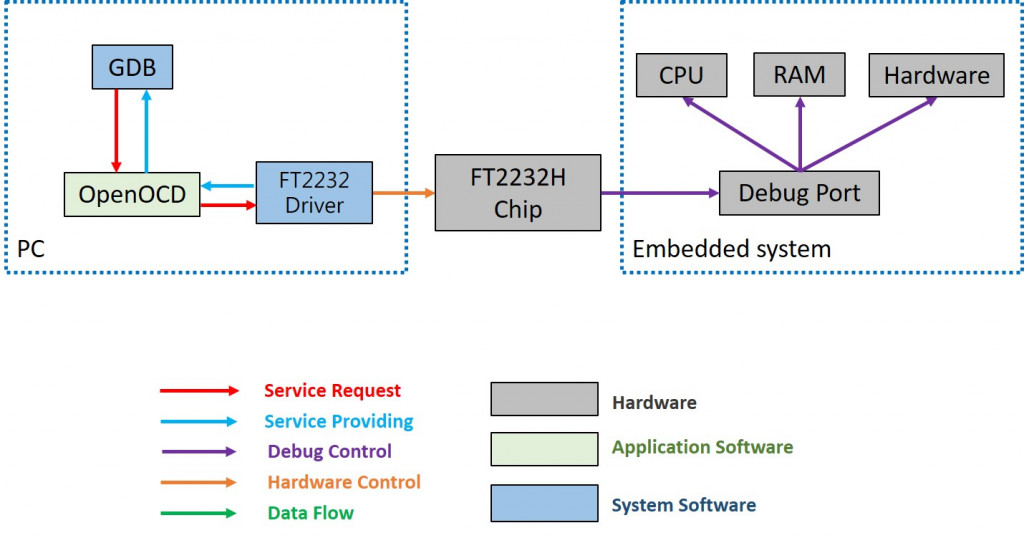


 iThome鐵人賽