前面的主題都是基本開頭,這一篇變為進階了!
其實我的基本跟進階的差別只是在常見或不常見的資料格式。
對一般人而言,常接觸到的資料儲存格式是csv, xml, txt等
但對於大家應該鮮少接觸到GeoTiff的資料格式。
GeoTiff是遙測觀測儀器常使用的資料儲存格式,遙測資料如衛星資料。
而GeoTiff僅是Tiff檔案格的一種特例,主要是多了地理資訊的訊息。
至於Tiff應該就相對常見,因為是處理圖形資訊常用的格式。
氣象局開放資料有提供GeoTiff格式的衛星資料,我們就來試試看吧
先到氣象局開放資料下載,如下圖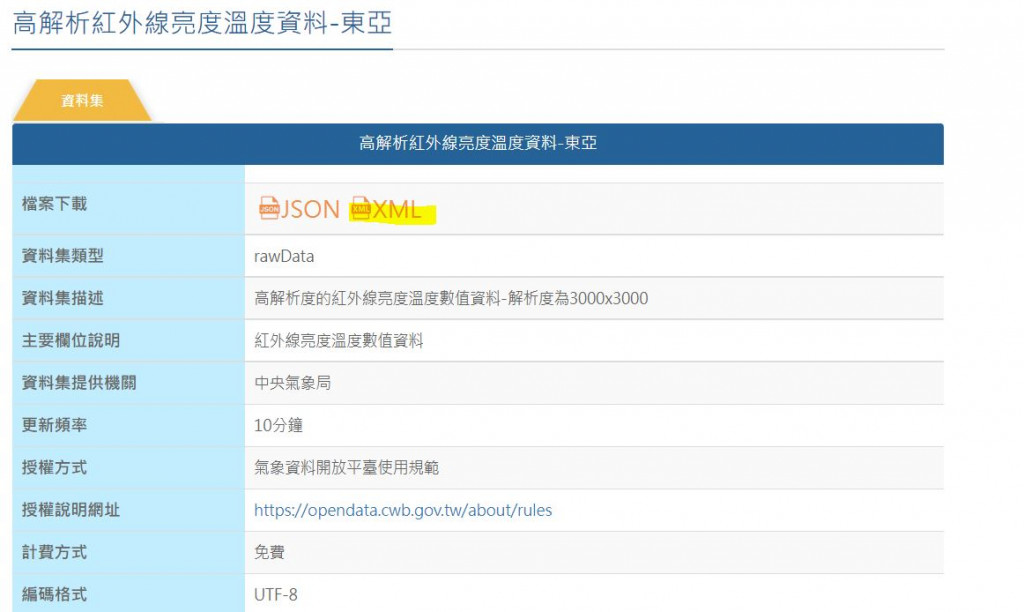
另外提供資料說明連結
下載xml檔案格式後,檔案名稱應該是O-B0056-001.xml,使用瀏覽器開啟xml,內容如下圖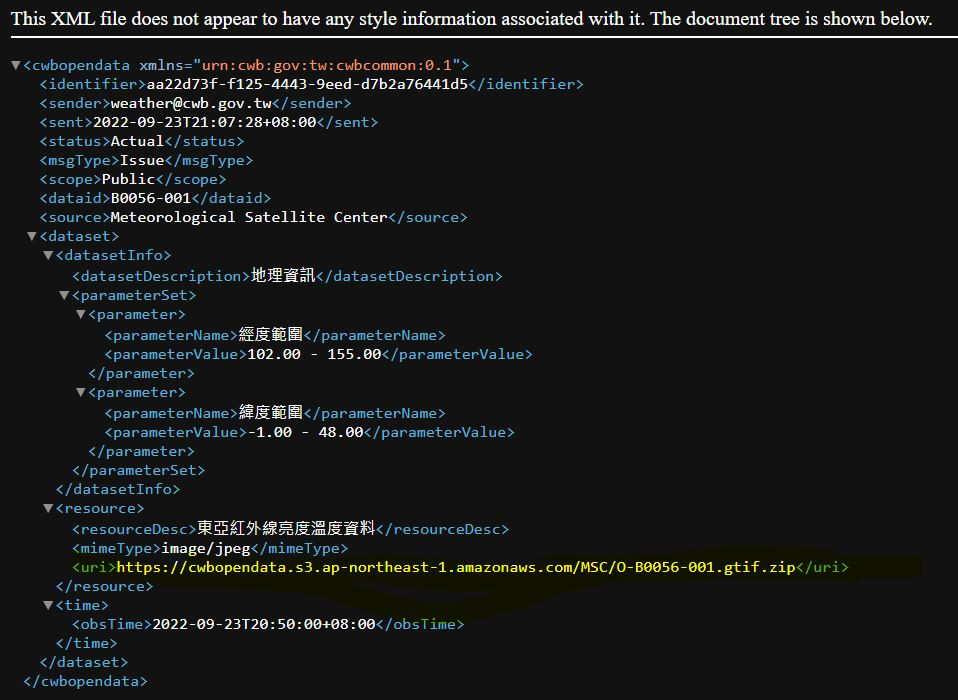
可以看到xml檔案裏面有提供一行連結網址,這個網址是GeoTiff資料的下載連結。
所以要能夠下載並且解壓縮,執行的程式如下
import zipfile, requests
import xmltodict as xdict

with open("O-B0056-001.xml", "r", encoding="utf-8") as fn:
    satdict = xdict.parse(fn.read())

url = satdict["cwbopendata"]["dataset"]["resource"]["uri"] #取得下載連結
print(url)
r = requests.get(url, stream=True) #下載檔案為連續檔案於記憶體

#將下載的檔案變為壓縮檔
with open("test.zip", 'wb') as fd:
    for chunk in r.iter_content(chunk_size=128):
        fd.write(chunk)

#解壓縮到該資料夾下的test資料夾
extractdir = "test"
with zipfile.ZipFile("test.zip", 'r') as zip_ref:
    listOfFileNames = zip_ref.namelist()
    for fileName in listOfFileNames:
        if fileName.endswith('.gtif'):
            zip_ref.extract(fileName, extractdir)
print(extractdir +"/" +fileName)
上面的程式執行完成後,應該會得到
https://cwbopendata.s3.ap-northeast-1.amazonaws.com/MSC/O-B0056-001.gtif.zip
test/data4/hsd/PG261/2022-09-23_2110.B13.LCC.gtif
那現在就是要讀取2022-09-23_2110.B13.LCC.gtif
這邊介紹使用gdal來解,安裝方式如下
conda install -c conda-forge gdal
或
pip3 install gdal
安裝完成後就開始解吧
gtifpath = extractdir +"/" +fileName
sattif = gdal.Open(gtifpath,gdal.GA_ReadOnly)
data  = sattif.GetRasterBand(1) #取值
data2arr = data.ReadAsArray() #僵值轉換為array
temp = data2arr/100. #說明文件有提到要將數值除以100
上面的程式就將亮度溫度讀取完成
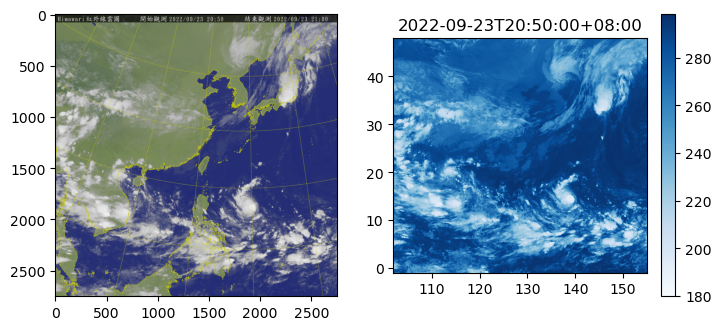
下面提供簡易的視覺化(沒有加投影資訊)
fig , axs = plt.subplots(1,2,figsize=(8,8))
axs[0].imshow(plt.imread("LCC_IR1_CR_2750-2022-09-23-20-50.jpg"))
ishow = axs[1].imshow(temp,cmap="Blues",extent=(lonst,lonend,latst,latend))
plt.colorbar(ishow,fraction=0.05)
plt.title(obsTime)
左邊的圖為氣象局觀測的紅外線雲圖,拿來驗證用的
右邊的圖是透過開放資料提供的亮度溫度繪製而成,看起來我們是有將資料讀對的