
若安裝好 Container Insights 後,我們可以透過 CloudWatch Agent 所收集的 metrics[1] 來進行監控 EKS worker node 附載狀況,以 node 層級來說可分為原生 EC2[2] 及 Container Insights 提供 metrics :
node_ 作為前綴(prefix),提供 memory、networking、filesystem metrics。而同時在 EC2 及 Container Insights 皆有提供對應的 networking metrics,那 node_network_total_bytes 與 EC2 NetworkIn/NetworkOut 都是提供 networking metrics,為什麼經常數值是不一致的。
iperf3[4] 命令的 image。$ cat ./iperf3-demo.yaml
apiVersion: v1
kind: Namespace
metadata:
name: iperf3
---
apiVersion: v1
kind: Pod
metadata:
name: iperf3-client
namespace: iperf3
spec:
containers:
- name: iperf3
image: networkstatic/iperf3
command:
- sleep
- infinity
imagePullPolicy: IfNotPresent
restartPolicy: Always
---
apiVersion: v1
kind: Pod
metadata:
name: iperf3-server
namespace: iperf3
spec:
containers:
- name: iperf3
image: networkstatic/iperf3
command:
- sleep
- infinity
imagePullPolicy: IfNotPresent
restartPolicy: Always
networkstatic/iperf3 Pod,一個作為 server side,另一個則作為 client side。$ kubectl apply -f ./iperf3.yaml
namespace/iperf3 created
pod/iperf3-client created
pod/iperf3-server created
i-01ac2403f4932c7ee。$ kubectl -n iperf3 get po -o wide
NAME READY STATUS RESTARTS AGE IP NODE NOMINATED NODE READINESS GATES
iperf3-client 1/1 Running 0 101s 192.168.25.186 ip-192-168-31-166.eu-west-1.compute.internal <none> <none>
iperf3-server 1/1 Running 0 101s 192.168.10.77 ip-192-168-31-166.eu-west-1.compute.internal <none> <none>
$ kubectl describe no ip-192-168-31-166.eu-west-1.compute.internal | grep "ProviderID"
ProviderID: aws:///eu-west-1a/i-01ac2403f4932c7ee
$ kubectl -n iperf3 exec -it iperf3-server -- iperf3 -s -f K
-----------------------------------------------------------
Server listening on 5201
-----------------------------------------------------------
Accepted connection from 192.168.25.186, port 55226
[  5] local 192.168.10.77 port 5201 connected to 192.168.25.186 port 55242
[ ID] Interval           Transfer     Bitrate
[  5]   0.00-1.00   sec  4.13 GBytes  4335092 KBytes/sec
[  5]   1.00-2.00   sec  3.84 GBytes  4030413 KBytes/sec
[  5]   2.00-3.00   sec  3.94 GBytes  4132195 KBytes/sec
[  5]   3.00-4.00   sec  4.09 GBytes  4290544 KBytes/sec
[  5]   4.00-5.00   sec  4.16 GBytes  4358426 KBytes/sec
[  5]   5.00-6.00   sec  4.11 GBytes  4310574 KBytes/sec
[  5]   6.00-7.00   sec  4.14 GBytes  4339151 KBytes/sec
[  5]   7.00-8.00   sec  3.87 GBytes  4052647 KBytes/sec
[  5]   8.00-9.00   sec  4.09 GBytes  4288227 KBytes/sec
[  5]   9.00-10.00  sec  4.08 GBytes  4274496 KBytes/sec
[  5]  10.00-10.00  sec   640 KBytes  1419069 KBytes/sec
- - - - - - - - - - - - - - - - - - - - - - - - -
[ ID] Interval           Transfer     Bitrate
[  5]   0.00-10.00  sec  40.4 GBytes  4241048 KBytes/sec                  receiver
-----------------------------------------------------------
Server listening on 5201
-----------------------------------------------------------
192.168.10.77。$ kubectl -n iperf3 exec -it iperf3-client -- iperf3 -c 192.168.10.77 -f K
Connecting to host 192.168.10.77, port 5201
[ 5] local 192.168.25.186 port 55242 connected to 192.168.10.77 port 5201
[ ID] Interval Transfer Bitrate Retr Cwnd
[ 5] 0.00-1.00 sec 4.13 GBytes 4335413 KBytes/sec 70 3.81 MBytes
[ 5] 1.00-2.00 sec 3.84 GBytes 4030116 KBytes/sec 35 2.16 MBytes
[ 5] 2.00-3.00 sec 3.94 GBytes 4130406 KBytes/sec 123 1.66 MBytes
[ 5] 3.00-4.00 sec 4.09 GBytes 4292478 KBytes/sec 14 1.60 MBytes
[ 5] 4.00-5.00 sec 4.16 GBytes 4358444 KBytes/sec 119 1.28 MBytes
[ 5] 5.00-6.00 sec 4.11 GBytes 4309678 KBytes/sec 52 2.06 MBytes
[ 5] 6.00-7.00 sec 4.14 GBytes 4338948 KBytes/sec 125 1.62 MBytes
[ 5] 7.00-8.00 sec 3.86 GBytes 4052472 KBytes/sec 63 1.52 MBytes
[ 5] 8.00-9.00 sec 4.09 GBytes 4289531 KBytes/sec 0 1.69 MBytes
[ 5] 9.00-10.00 sec 4.08 GBytes 4273572 KBytes/sec 28 1.95 MBytes
- - - - - - - - - - - - - - - - - - - - - - - - -
[ ID] Interval Transfer Bitrate Retr
[ 5] 0.00-10.00 sec 40.4 GBytes 4241094 KBytes/sec 629 sender
[ 5] 0.00-10.00 sec 40.4 GBytes 4241048 KBytes/sec receiver
iperf Done.
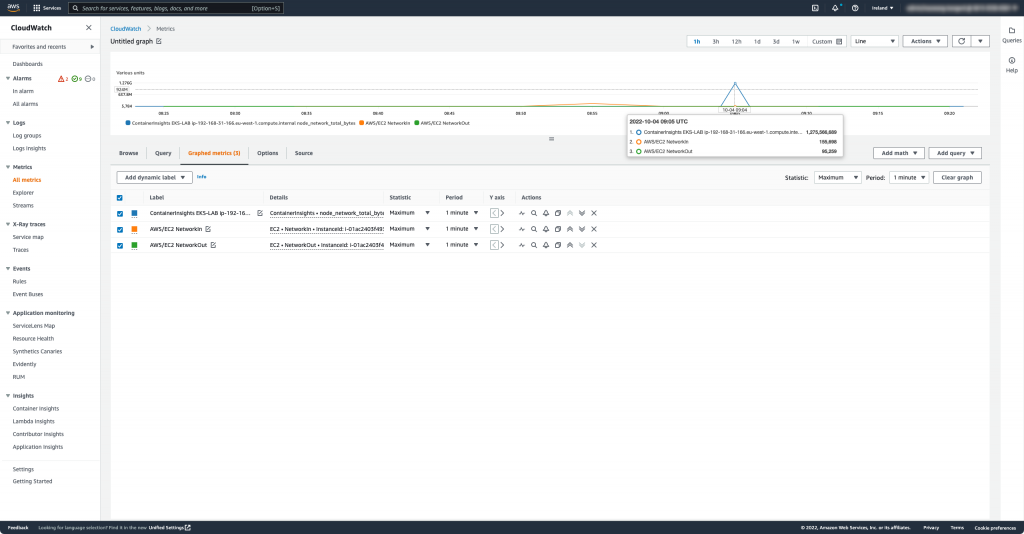
時間 2022-10-04 09:05 UTC 分別以下數值,可以觀察到 node_network_total_bytes 遠高於 NetworkIn/NetworkOut:
node_network_total_bytes: 1,275,566,689以下分別根據文件定義:
node_network_total_bytes[1]:Cluster 中每一個 node 每秒通過 network transmitted 及 received 的總 bytes。NetworkIn[2]:instance 在所有 network interface 上接收(received)的總 bytes。NetworkOut[2]:instance 在所有 network interface 上發出( sent out )的總 bytes。於 Day 18,我們知道 CloudWatch Agent 是藉由 kubelet 提供 cadvisor metrics。因此可以查看在 CloudWatch source code 於 containerinsightscommon module 定義 const name NetTotalBytes。
NetTotalBytes = "network_total_bytes"
接續在 input cadvisor net_extractor GetValue() 驗證是由作業系統層級的各個 network interface RX 及 TX 數值累計。
	if preInfo, ok := n.preInfos.Get(info.Name); ok {
		curStats := GetStats(info)
		preStats := GetStats(preInfo.(*cinfo.ContainerInfo))
		deltaCTimeInNano := curStats.Timestamp.Sub(preStats.Timestamp).Nanoseconds()
		if deltaCTimeInNano > MinTimeDiff {
			curIfceStats := getInterfacesStats(curStats)
			preIfceStats := getInterfacesStats(preStats)

			// used for aggregation
			var netIfceMetrics []map[string]float64

			for _, cur := range curIfceStats {
				for _, pre := range preIfceStats {
					if cur.Name == pre.Name {
						mType := getNetMetricType(containerType)
						netIfceMetric := make(map[string]float64)
						...
						...
						...
						netIfceMetric[NetTotalBytes] = netIfceMetric[NetRxBytes] + netIfceMetric[NetTxBytes]
然而 EC2 metrics NetworkIn 及 NetworkOut 主要則是依據 Elastic network interfaces(ENI)[5] 個別計算 instance,因此依照上述實驗 Pod server-side 及 client-side 皆是在同一個 node,並不會透過 ENI 網卡,因此並不會計算於 NetworkIn 及 NetworkOut。
client Pod eth <-> host veth <-> host veth <-> server Pod eth
EC2 metrics 是以 AWS 環境,以 instance 層級收集所有 ENI network 網路進出 metrics;Container Insight node_network_total_bytes 則是根據作業系統層級收集所有 network device 網路進出 metrics。

 iThome鐵人賽